In this article, you’ll learn what Overview shows and how to interpret the information.
How to View Stats
-
You can either go to your Admin Panel > Search > Analytics or directly from the home page, clicking on the Analytics section. The Overview panel will appear automatically.
-
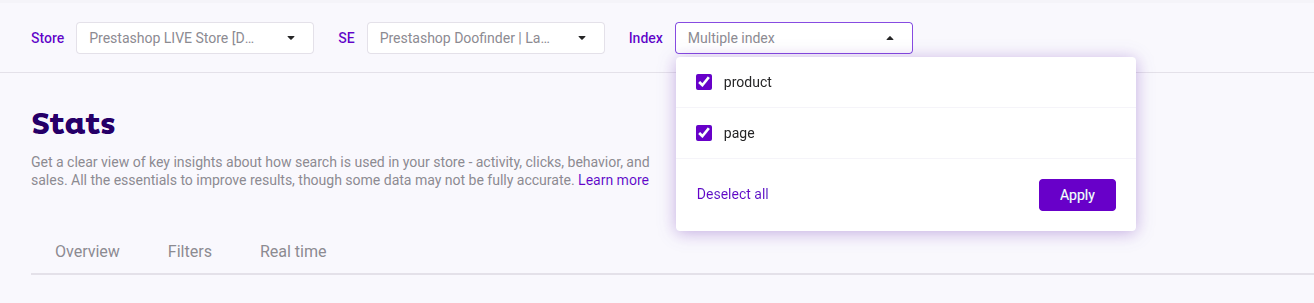
Before analyzing the data, look at the top bar, this is where you can filter what you want to see:
- Select the Store you want to view stats for.
- Select the Search Engine(s) whose stats you want to see.
- If your setup includes multiple indices, choose the indices (for example, products, blogs, or categories) you want to analyze.
Use the filters from the dropdown menus in the top bar to choose which store, search engine, and content indices you want to see stats for before exploring any data.
-
Select the periods to compare data.
Keep reading to explore Overview.
Settings Options
Before scrolling down, you’ll find a Settings option in the top-right corner.
-
Download logs
- Click on Settings whenever you want to download logs for a Search Engine.
- Search statistics logs are saved for 90 days.
-
Filter IPs from Stats
- Use this option to exclude IPs from your analytics data.
- Add as many IPs as needed to keep your reports accurate.
Period & Device Selectors
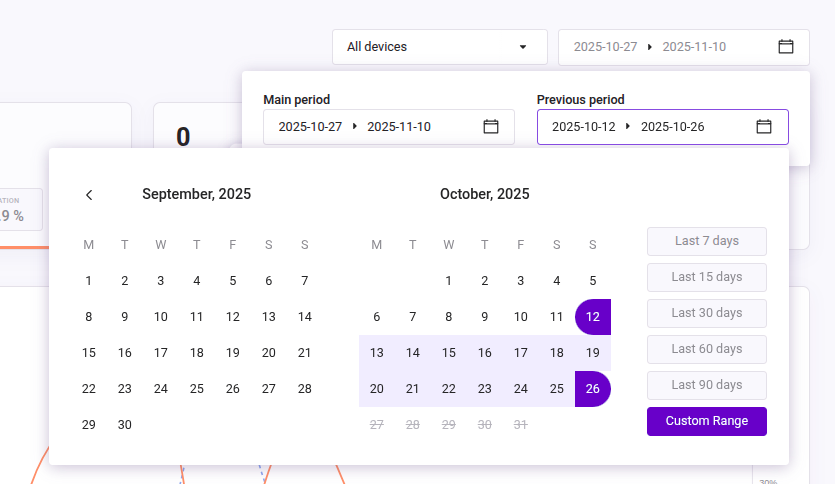
Below the Settings icon, you’ll find a Period Selector menu to choose and compare time ranges. All data in the panel updates automatically based on your selections.
Information always compares two periods:
- The main period
- The previous period
You can also filter by device type to analyze desktop and/or mobile performance.
Example:
Compare search activity from all devices over the last 7 days. Select Last 7 Days as your main period, the previous period will automatically adjust to the previous 7 days.
| Change Period Type | Result |
|---|---|
| Changing the main period | The previous period adjusts automatically with the same date range. |
| Changing the previous period | The main period remains fixed as you may want to compare the previous period with the main period as it is. |
Always review your previous period selection to ensure accurate comparisons. “Previous period” refers to the one you select, not necessarily the period immediately before.
Plans Considerations to Select Periods in Stats
For Basic plans: Main Period from today to the last 60 days; Previous Period from today to the last 120 days.
For Pro and Advanced plans: Main Period from today to the last 365 days; Previous Period from today to the last two years.
How Search Performs in Your Store
This section displays information blocks and a graph showing search performance metrics.
Use them to detect improvement areas and optimize results directly from your Admin Panel. Each metric includes tooltips when hovering, use them to explore detailed data.
Statistics Blocks
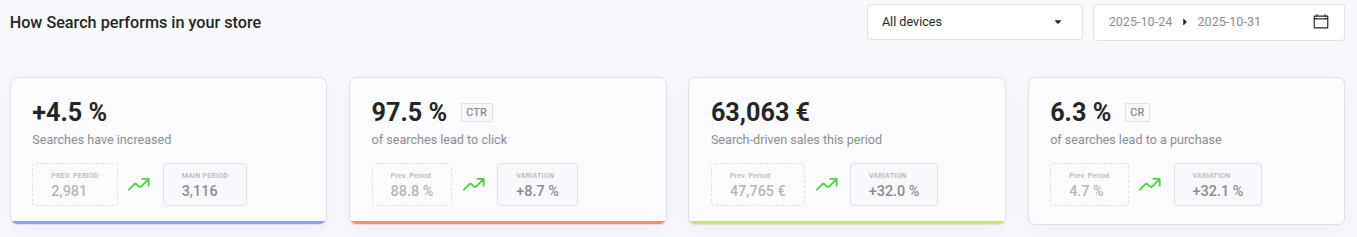
From the following metrics, we recommend to focus on the CTR. It is a powerful indicator of search success and one of the simplest metrics to optimize with Doofinder’s Search. A healthy CTR means your customers are connecting with the products they want.
| Metric | Shows | Information on Hover |
|---|---|---|
| Searches Performed in the Search Bar |
The percentage of searches in Search compared to the previous period. Displays traffic variation and trend with the previous period. |
- Current and previous traffic sessions. - Total number of traffic sessions. - Number of search sessions. - Percentage of your web shoppers using Search. - 6-month average of search usage in your store. |
| Click-Through Rate (CTR) |
The percentage of searches that led to clicks during the selected main period. Displays clicks variation and trend with the previous period. |
- Total clicks for current and previous periods. - Industry CTR for the same main period. - 6-month CTR average of your store. |
| Search-Driven Sales |
The total sales generated through Search in the main period. Displays sales variation and trend compared to the previous period. |
- Percentage of sales generated via search over your site’s sales within the main period. - Number of orders and average order value. - 6-month average order value for your store. |
| Conversion Rate (CR) |
Calculated by dividing the number of purchases by the number of sessions. Displays conversion rate variation and trend with the previous period. |
- Total orders (main and previous periods). - Industry CR for the same main period. - 6-month CR average of your store. |
For the industry CTR to be accurate you need to choose it correctly in General Settings. Also, ensure your URLs are accurate and useful by being correctly configured in Sales Data.
Currency displayed is the one you select on Statistics Currency.
If your metrics are trending downward, go to Configure and Improve Search Performance with Stats Insights to discover actions you can take to improve results, enhance the search experience, and increase your sales.
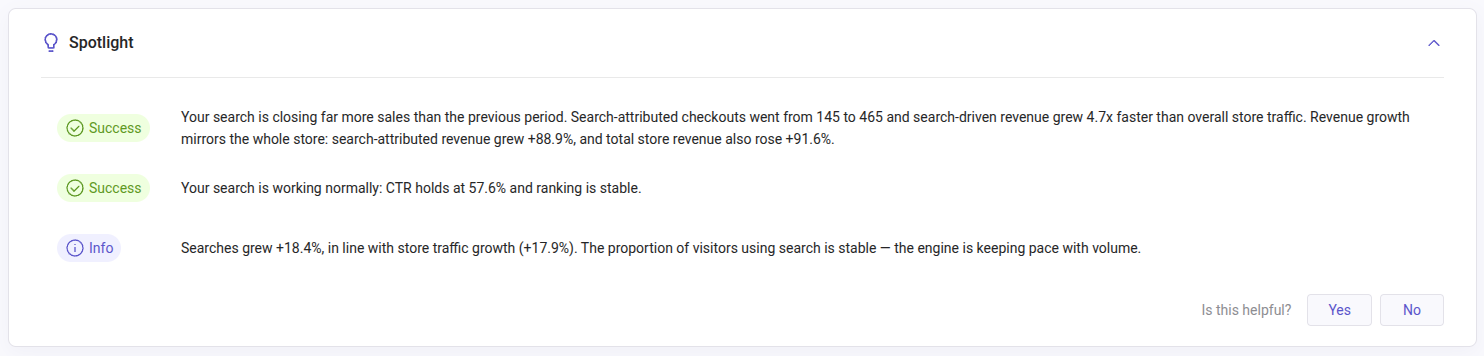
Spotlight
The Spotlight is a diagnostic panel in the Search stats page, under the Overview tab. It sits between the KPIs and the charts. Spotlight turns raw search metrics into plain language actionable takeaways. This way, you don't have to interpret every KPI separately. It shifts the Search stats page from just showing data to explaining what it means and what to do about it.
Main takeaways:
- Automatically compares the selected period vs. the previous one to spot meaningful changes in searches, CTR, sales, conversion, etc.
- Generates a prioritized list of insights, each tagged by severity: Critical, Warning, Success, Info.
- The collapsed view shows a count summary by severity (e.g.: 1 Correct, 2 Information).
- Expanded view shows the full explanation for each insight (e.g., checkout drop tied to lower average basket, stable CTR/ranking, no-results searches flagged as a missed opportunity).
- If there's not enough data, it says so instead of guessing.
No manual setup needed, as well as it respects the date range and device filters already applied on the page.
Statistics Graph
Below the Statistics blocks, the Statistics Graph displays day-by-day performance within the selected main period.
You can visualize Searches, CTR, and Sales metrics.
-
Hover over any bar to see details for that day.
-
Use checkboxes to show or hide individual metrics.
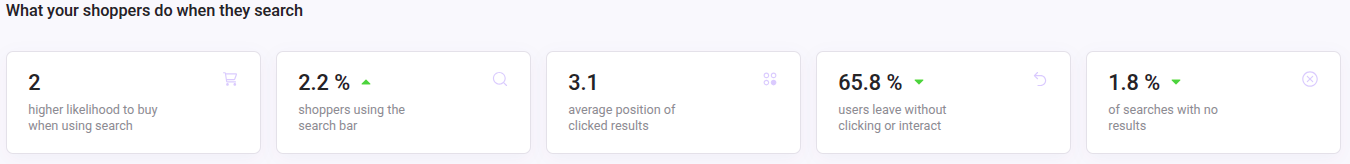
What Shoppers Do When They Search
This section reveals behavioral insights helping you understand how your shoppers interact with Doofinder’s Search and how satisfied they are with results.
| Metric | Shows | Information on Hover |
|---|---|---|
| Times More Likely to Buy When Using Search |
Indicates how many times more likely shoppers are to buy when they use Doofinder’s Search. This metric compares session conversion rates. |
- Percentage of buyers using search vs. those not using it. - Previous period data likelihood. - 6-month average search conversion percentage. |
| Shoppers Using the Search Bar | The percentage of your shoppers who use the search bar during their visit. |
- Previous period percentage. - Industry search usage percentage. - 6-month average search usage rate. |
| Average Position of Clicked Results |
The average position in search results where shoppers click products. Helps identify product ranking relevance. |
- Previous period position average. - Industry average. - 6-month average for your store. |
| Users Leave Without Clicking or Interacting |
The percentage of sessions where users perform a search but leave without clicking any result. Measures engagement quality during a user’s session. Example: 3 out of 4 users used search, only 1 clicked on a product. Therefore, 75% of sessions leave without clicking. Read this faq to understand the difference between CTR and Users Leave Without Clicking (Exit Rate). |
- Previous period percentage. - Recommended actions to reduce exit rate. |
| Searches with No Results | The percentage of search queries returning no results, indicating potential improvement for searched terms. |
- Previous period percentage. - Industry no results ratio. - 6-month average for your store. |
If your metrics are trending downward, go to Configure and Improve Search Performance with Stats Insights to discover actions you can take to improve results, enhance the search experience, and increase sales.
Explore What People Search and What They Find
See which terms your shoppers search for and which products they click.
Searched terms
Shows:
- Search terms used
- Count: total searches per term
- CTR: percentage of searches leading to clicks
- Click Pos.: average position of clicked products
- A search bar to find specific terms
Hover to view product details and click Details to list all items clicked for that term.
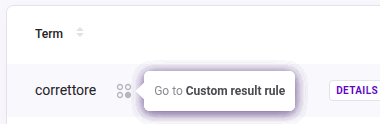
If a custom result applies, a four-dot icon appears, click it to open the corresponding Custom Result.
Clicked results
Shows:
- Items clicked in search results
- Total clicks
- CTR and Click Position
- A search bar to find specific products
Hover to view product information and click Details to display the list of terms from the queries performed.
Download Stats Reports
You can download detailed CSV reports for deeper analysis. However, notice that there is a defined limit that permits data to be downloaded for a maximum period of three months.
Click the CSV button, a download link will be sent to your email.
| Report | Description |
|---|---|
| All Search Terms | Includes Search Engine, queries, total searches per query, clicks, CTR, CR, product ID, average position, and revenue generated. |
| No-Results Terms | Same fields as above. This report is essential to find high-searched terms with no-result to take action. |
| Clicked Results | Includes Search Engine, product IDs, name of the product clicked, link, clicks on product, CTR, CR, average position, search query performed to find the product, total searches, and total searches clicks. |
If you notice a discrepancy between the revenue shown and the CSV download, be aware that the admin shows total cart revenue from sessions with Doofinder activity, while the CSV shows only revenue from products directly clicked in search results. With that said:
- Admin revenue: this metric sums the total value of the shopping cart for each session in which the user interacted with the Doofinder search engine. For example, if a user searches for “running shoes”, adds it to the cart, and subsequently adds two additional products, the KPI includes the value of all three products.
- Top clicked CSV: This report only displays the revenue generated from products that were clicked through the search results. If the other two products were not clicked within the search interface, they will not be included in the CSV.
Fix Zero-Results Searches: Add Synonyms or Custom Results
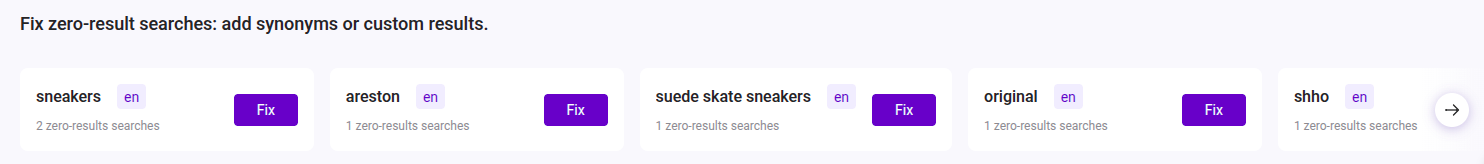
This carousel shows searches returning no results during the selected main period.
Each card displays:
- Search term
- Search Engine language
- Number of zero-result searches for the term
- Fix button: click Fix to open the Synonyms or Custom Results panel.
Read Configure and Improve Search Performance with Stats Insights to learn how to define Synonyms or Custom Results to solve zero-result searches.