Usage consumption data of your Stores is available in your account’s Usage section.
To access it, go to your Doofinder Admin Panel > Account (bottom of the left-side menu) > Usage.
Overview
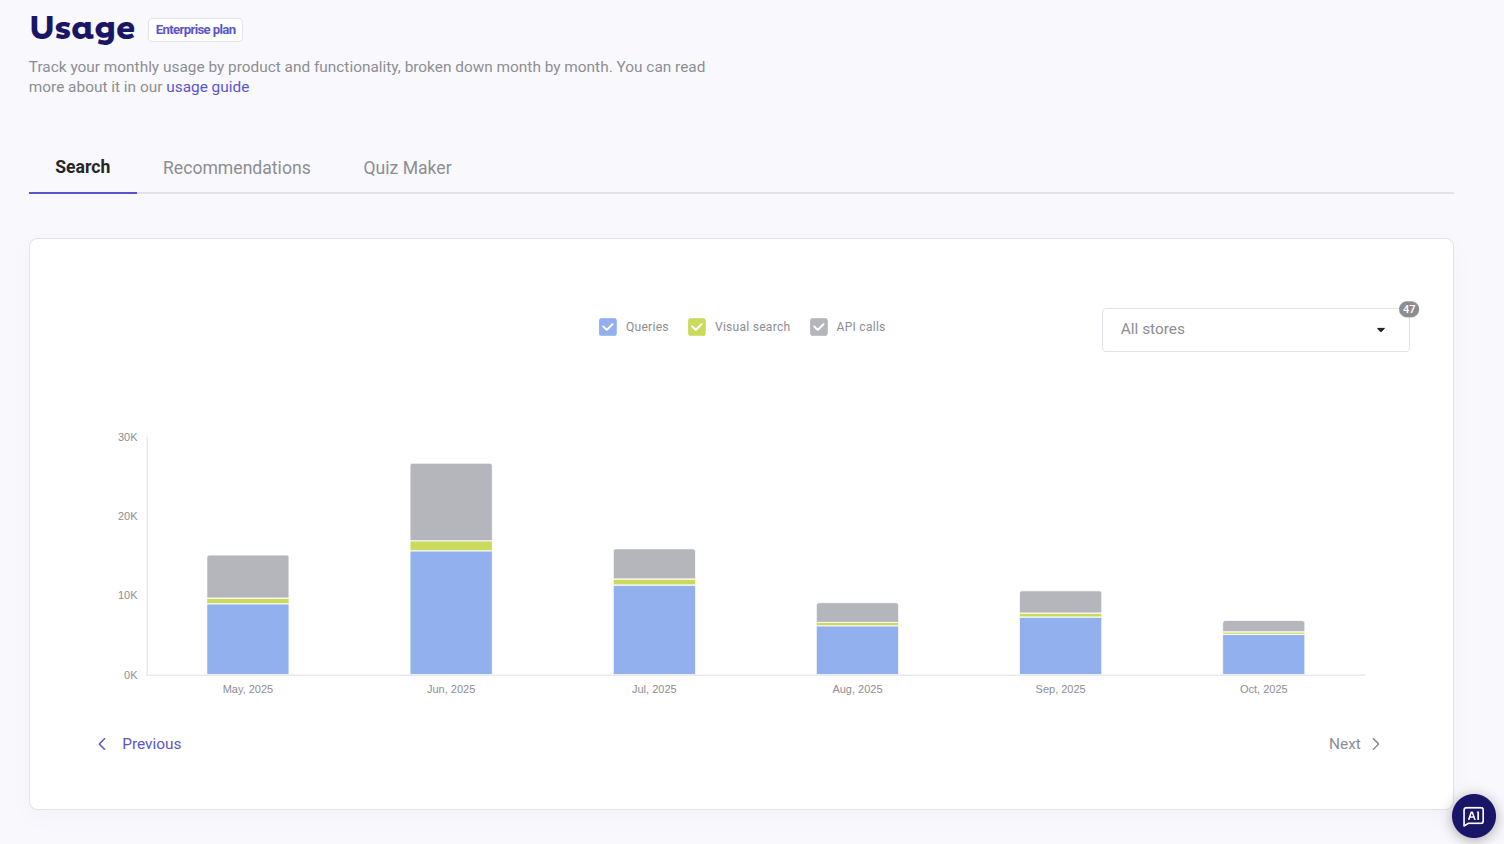
The Usage panel provides a clear view of your request consumption over time by displaying your monthly consumption graph for each product at Store level, with data from all stores shown by default.
Request usage for the current month is updated daily and reflects data up to the previous day. You can track how your request usage has behaved in previous months and how it is trending in the current month.
The panel includes the following sections and features:
Show Usage for One or More Stores
On the right side of the graph, you will find a dropdown menu. By default, All stores are selected, showing the total consumption of your plan.
To view the monthly consumption of a specific store, select it from the dropdown menu. Your selection will be maintained as you navigate through each product.
In the dropdown menu, you can also select deleted stores to view historical usage for all the stores created in Doofinder.
View Product Usage
At the top of the panel, you will see a tab for each product. Navigate through each tab to see the consumption generated.
Display Usage Consumption per Functionality
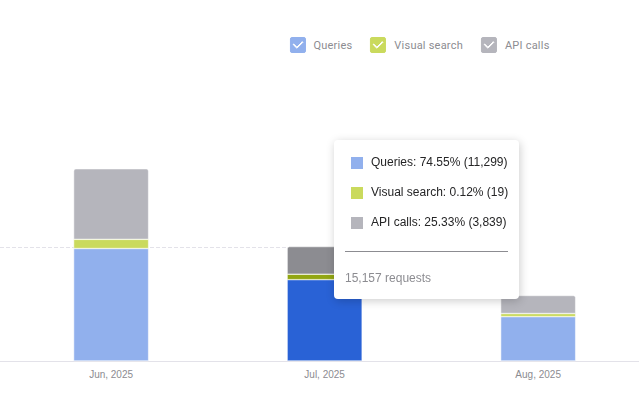
Within Search, you can view your usage consumption per functionality in two ways:
- In each graph, you can select the functionalities for which you want to see consumed requests. Go to the functionality directory inside the graph and click the checkbox to add or remove functionalities to display.
- With all functionalities selected, hover over any months’ bar to see a tooltip displaying requests consumed, the percentage for each functionality, and the total for all of them.
Enterprise Plans Considerations
If you are on an Enterprise plan and do not use Search, your API Calls will appear under the product contracted, not in the Search graph.
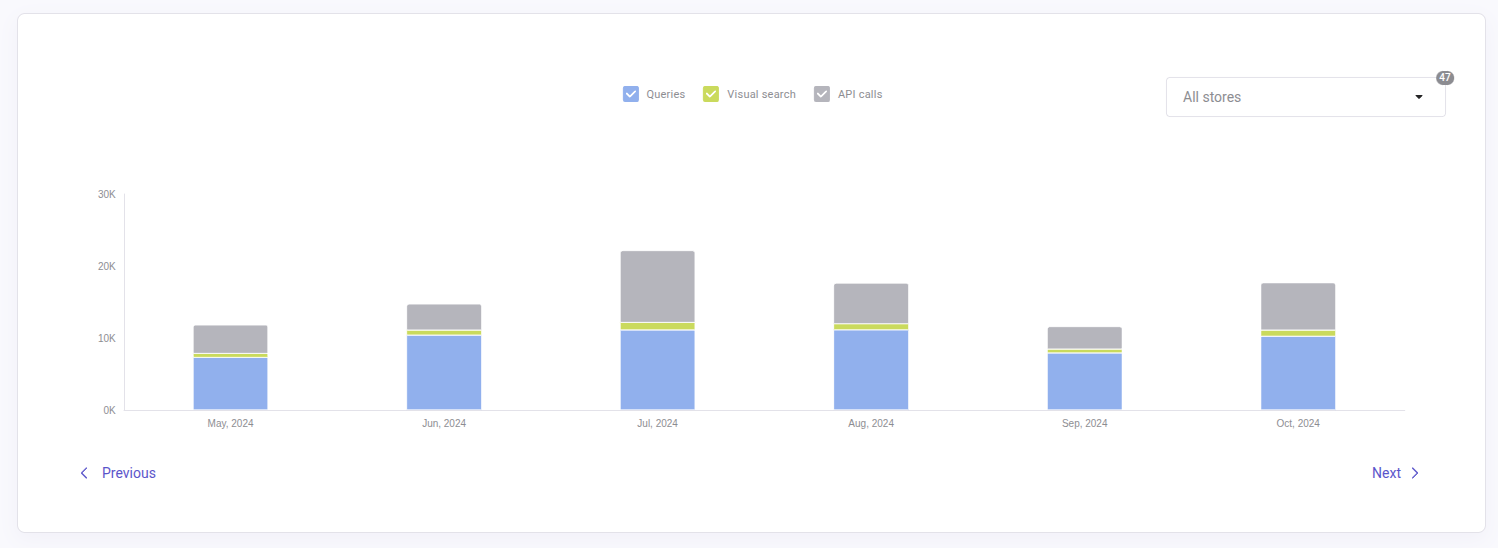
See Previous Months' Usage
You can view your usage from previous months to compare and review consumption from other periods. Click the “Previous” button at the bottom of the graph to go back to other periods, and the “Next” button to return to the current period.
This graph shows historical usage for all your stores (including deleted ones), allowing you to track usage from the very beginning.
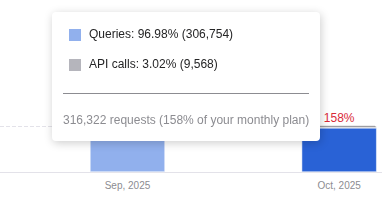
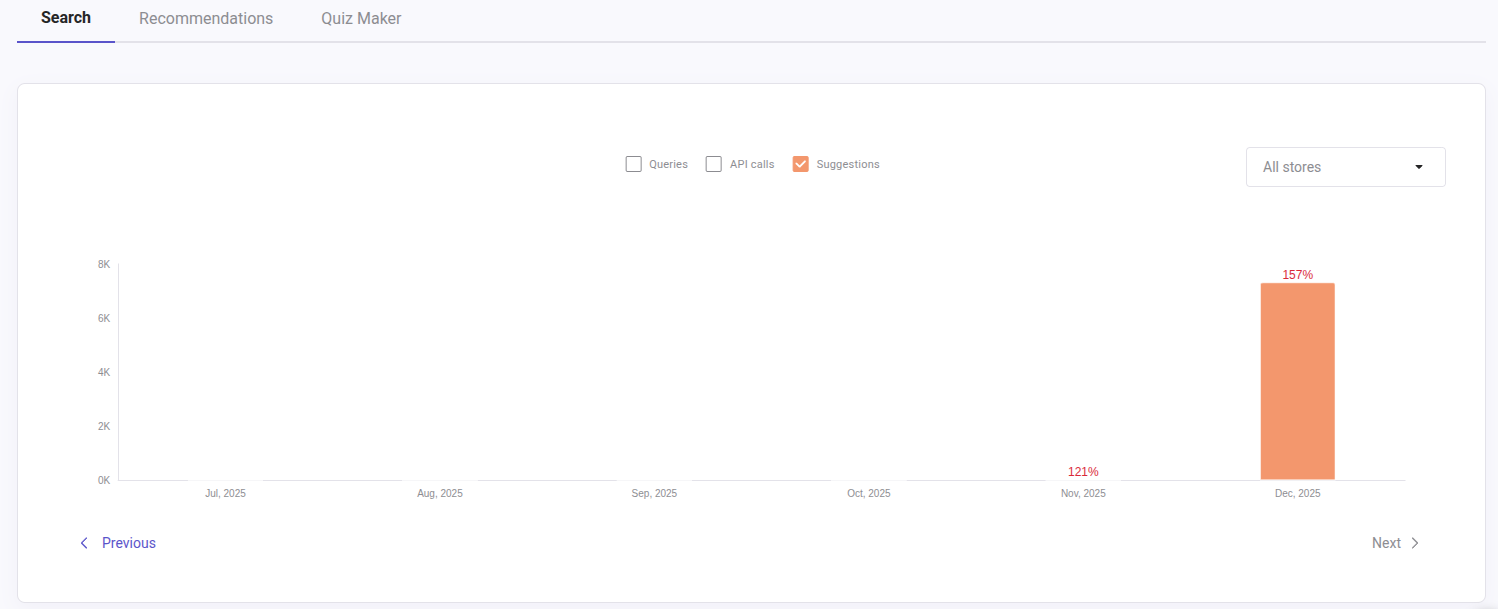
Consumption Exceeded Notification
Your plan includes a limited number of requests per month. While the service won’t stop if you exceed this limit, Doofinder will notify you when usage exceeds 120% of your plan, adding a percentage flag on top of the exceeded monthly bar, and in the tooltip. For example, if your usage reaches 158%, the percentage flag will display 158%.
If this occurs for several consecutive months, it may indicate that your current plan is not suitable. We recommend reviewing other available plans. Take a look at our plans.
Usage and Requests
Below is a summary of the types of requests that may appear in your dashboard for each product. For details on how requests are calculated, refer to How is Usage Calculated?.
Search
Requests in Search are generated as follows:
Queries
Requests are generated whenever a customer types in the search bar, including searches, clicked filters, similar products, and suggestions.
Search is executed in every configured index. If you have multi-indices activated, each search query counts for each index, multiplying the requests.
For daily usage on Search, refer to the Stats page; for more information on Stats, refer to this documentation.
Visual Search
Requests generated when users search by image using the Visual Search feature.
API Calls
Requests are generated each time your feed (or feeds, if using multiple indices) is processed, including all indexing requests via feed or API. Real-time indexing through plugins may increase API Call requests.
Navigating the Doofinder Admin Panel also generates requests, such as when loading statistics.
As previously mentioned, if you’re on an Enterprise plan and only use Recommendations, your API calls will appear in the Recommendations graph.
Suggestions
Suggestions have their own index, which generates requests with weekly indexing. When active, each search generates separate requests to the suggestion index. You can check the consumption under the Search tab:
Find a detailed explanation on how requests work in How is Usage Calculated?.
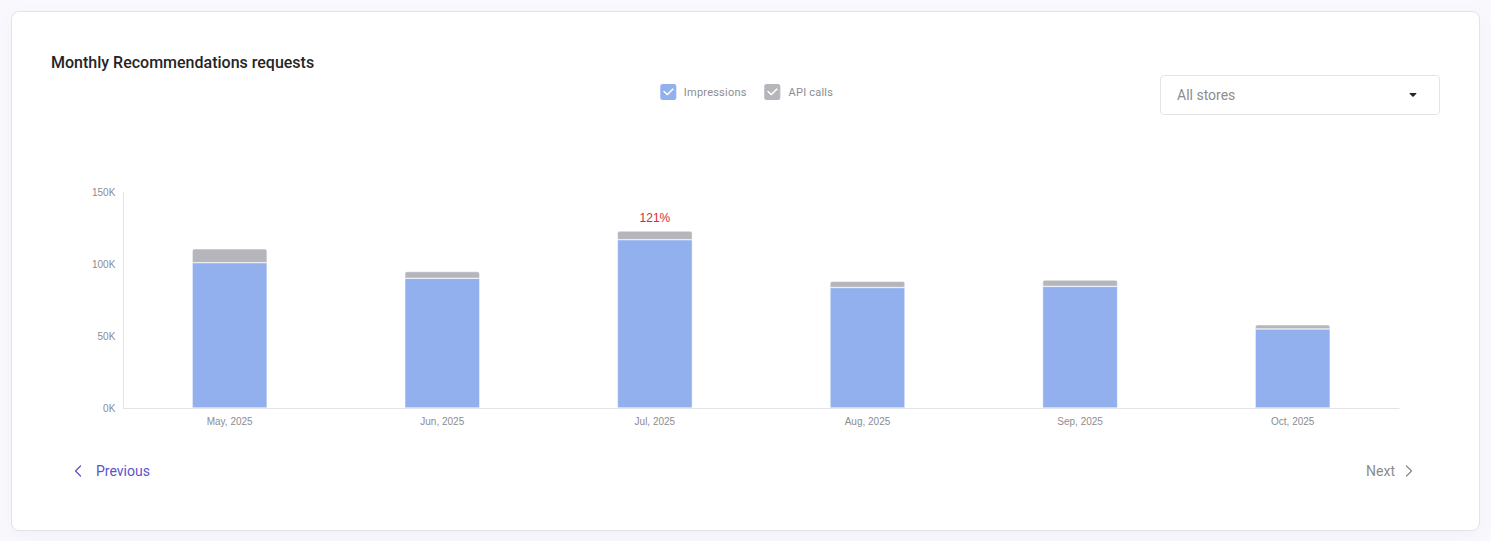
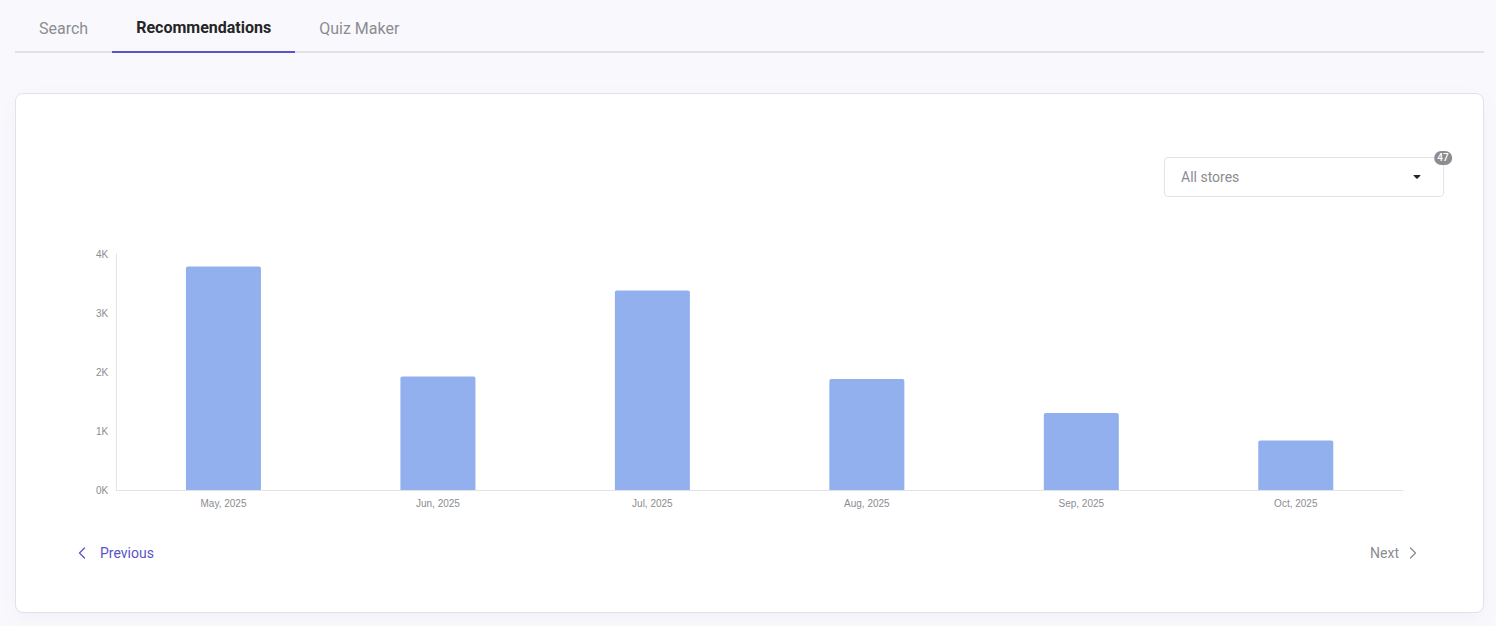
Recommendations
Each time the recommendation carousel appears on a page, it counts as a request.
In your Recommendations main panel, you can check the number of impressions (requests) generated by each carousel.
As previously mentioned, if you’re on an Enterprise plan and only use Recommendations, your API calls will appear in the Recommendations graph.
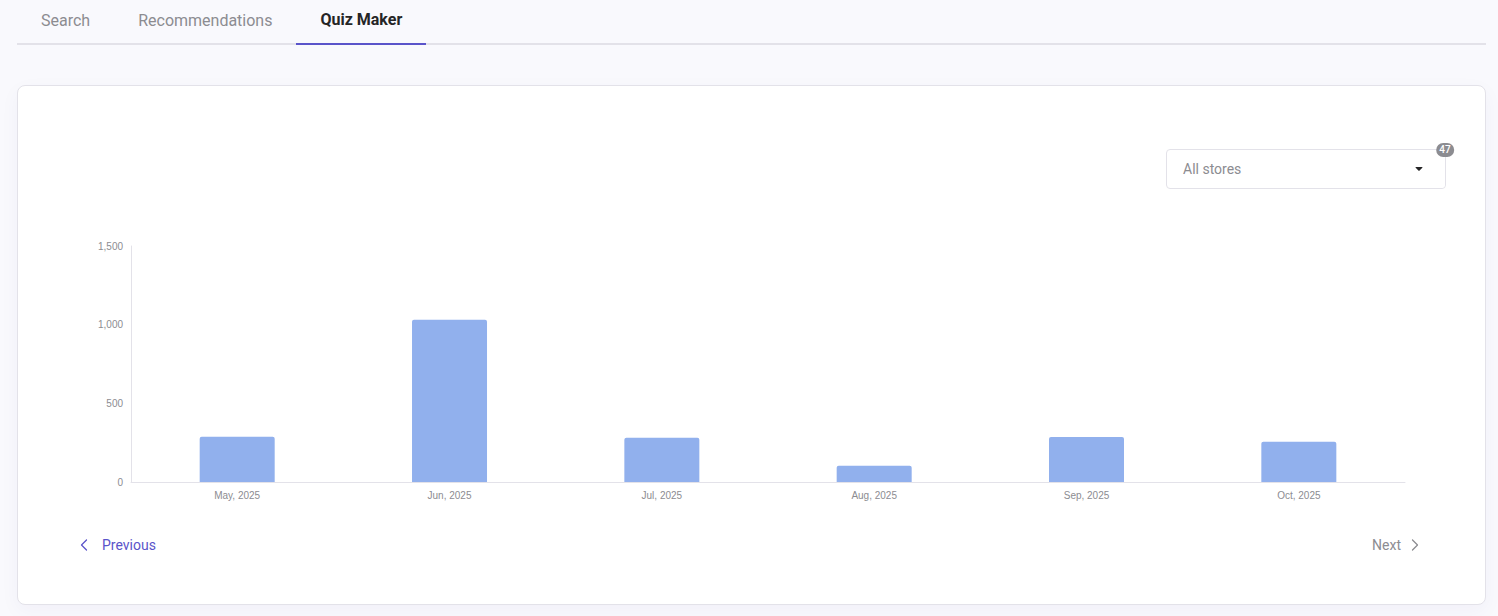
Quiz Maker
A request is generated when the Quiz Maker is opened and for each new screen.
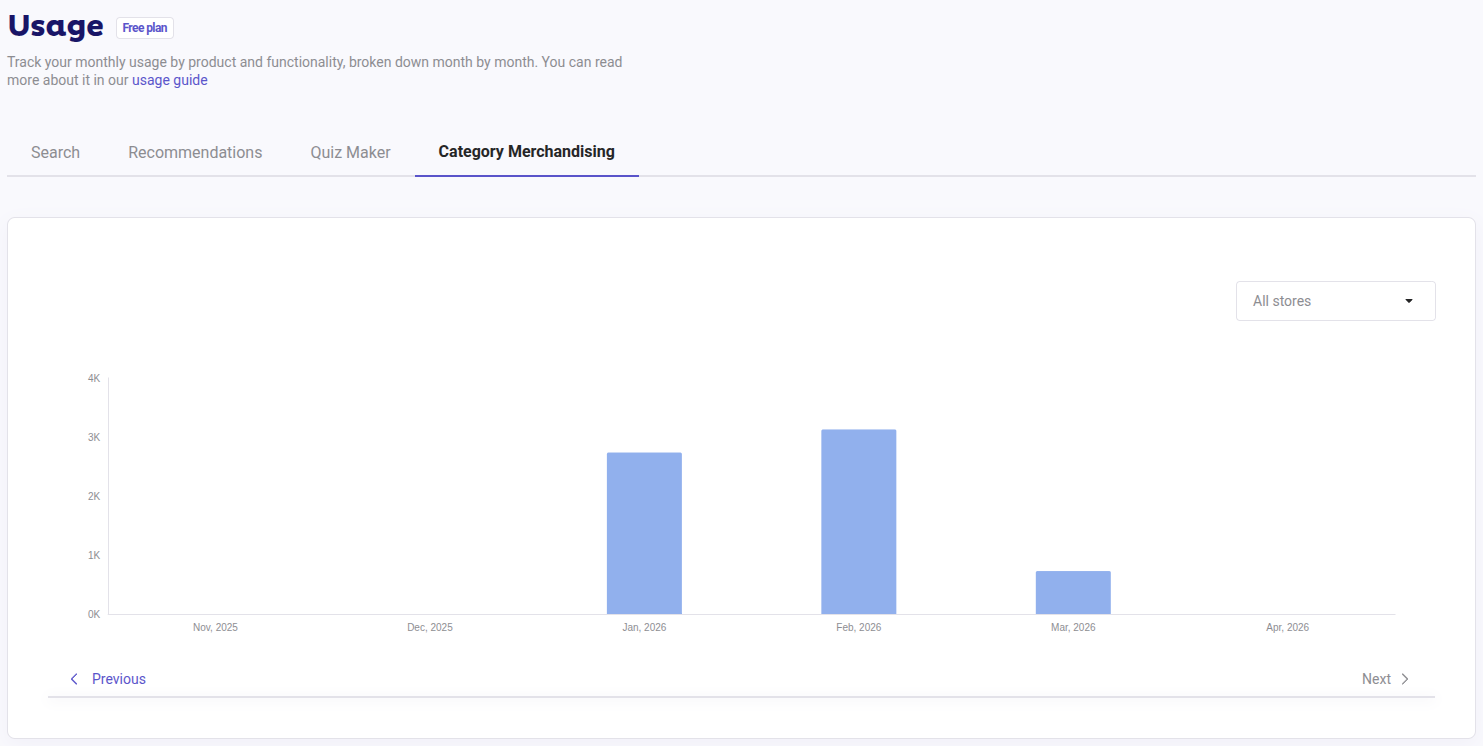
Category Merchandising
Category Merchandising requests are counted similarly to search requests (see above). They are consumed when content is displayed on the webpage and when users interact with filters. The system functions similarly to an embedded layer, so usage is expected to be consistent with other request types.
Once the Category Merchandising API is enabled, requests will be counted per API call.