The Statistics tool shows you data about all your Search Engine metrics within a period of time. This is where you can view the metrics on the number of searches, the top clicked products, new opportunities and so on. This tool can help you identify trends and behaviors from your customers to boost your sales.
How To Interpret Charts
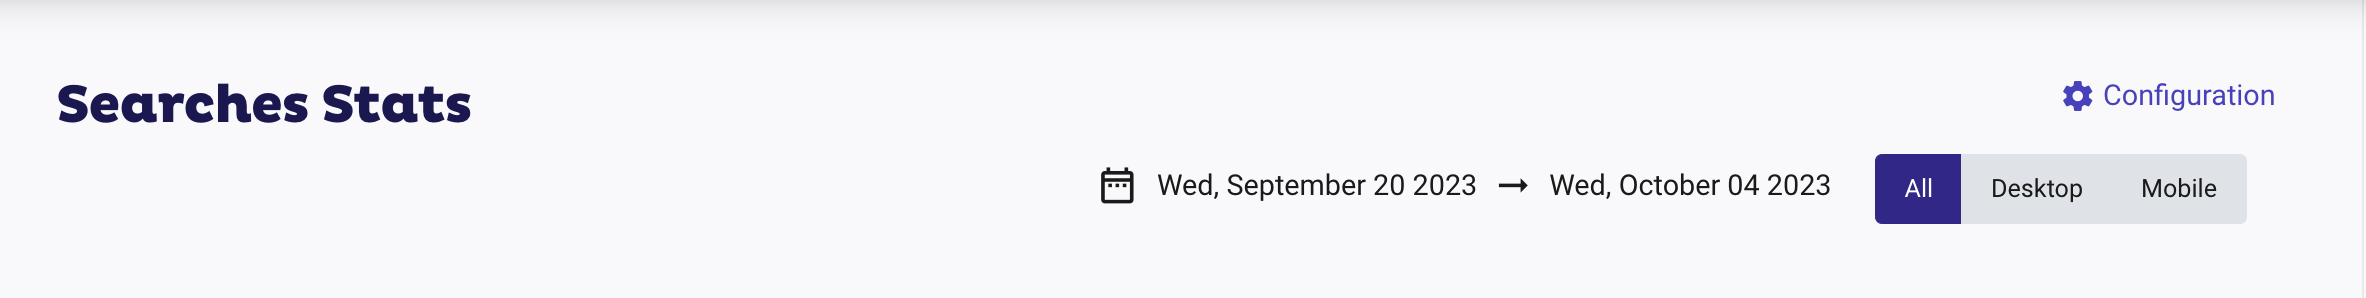
To see your statistics, go to your Admin panel > Search Engines > Stats. Let's click on Searches for this example.
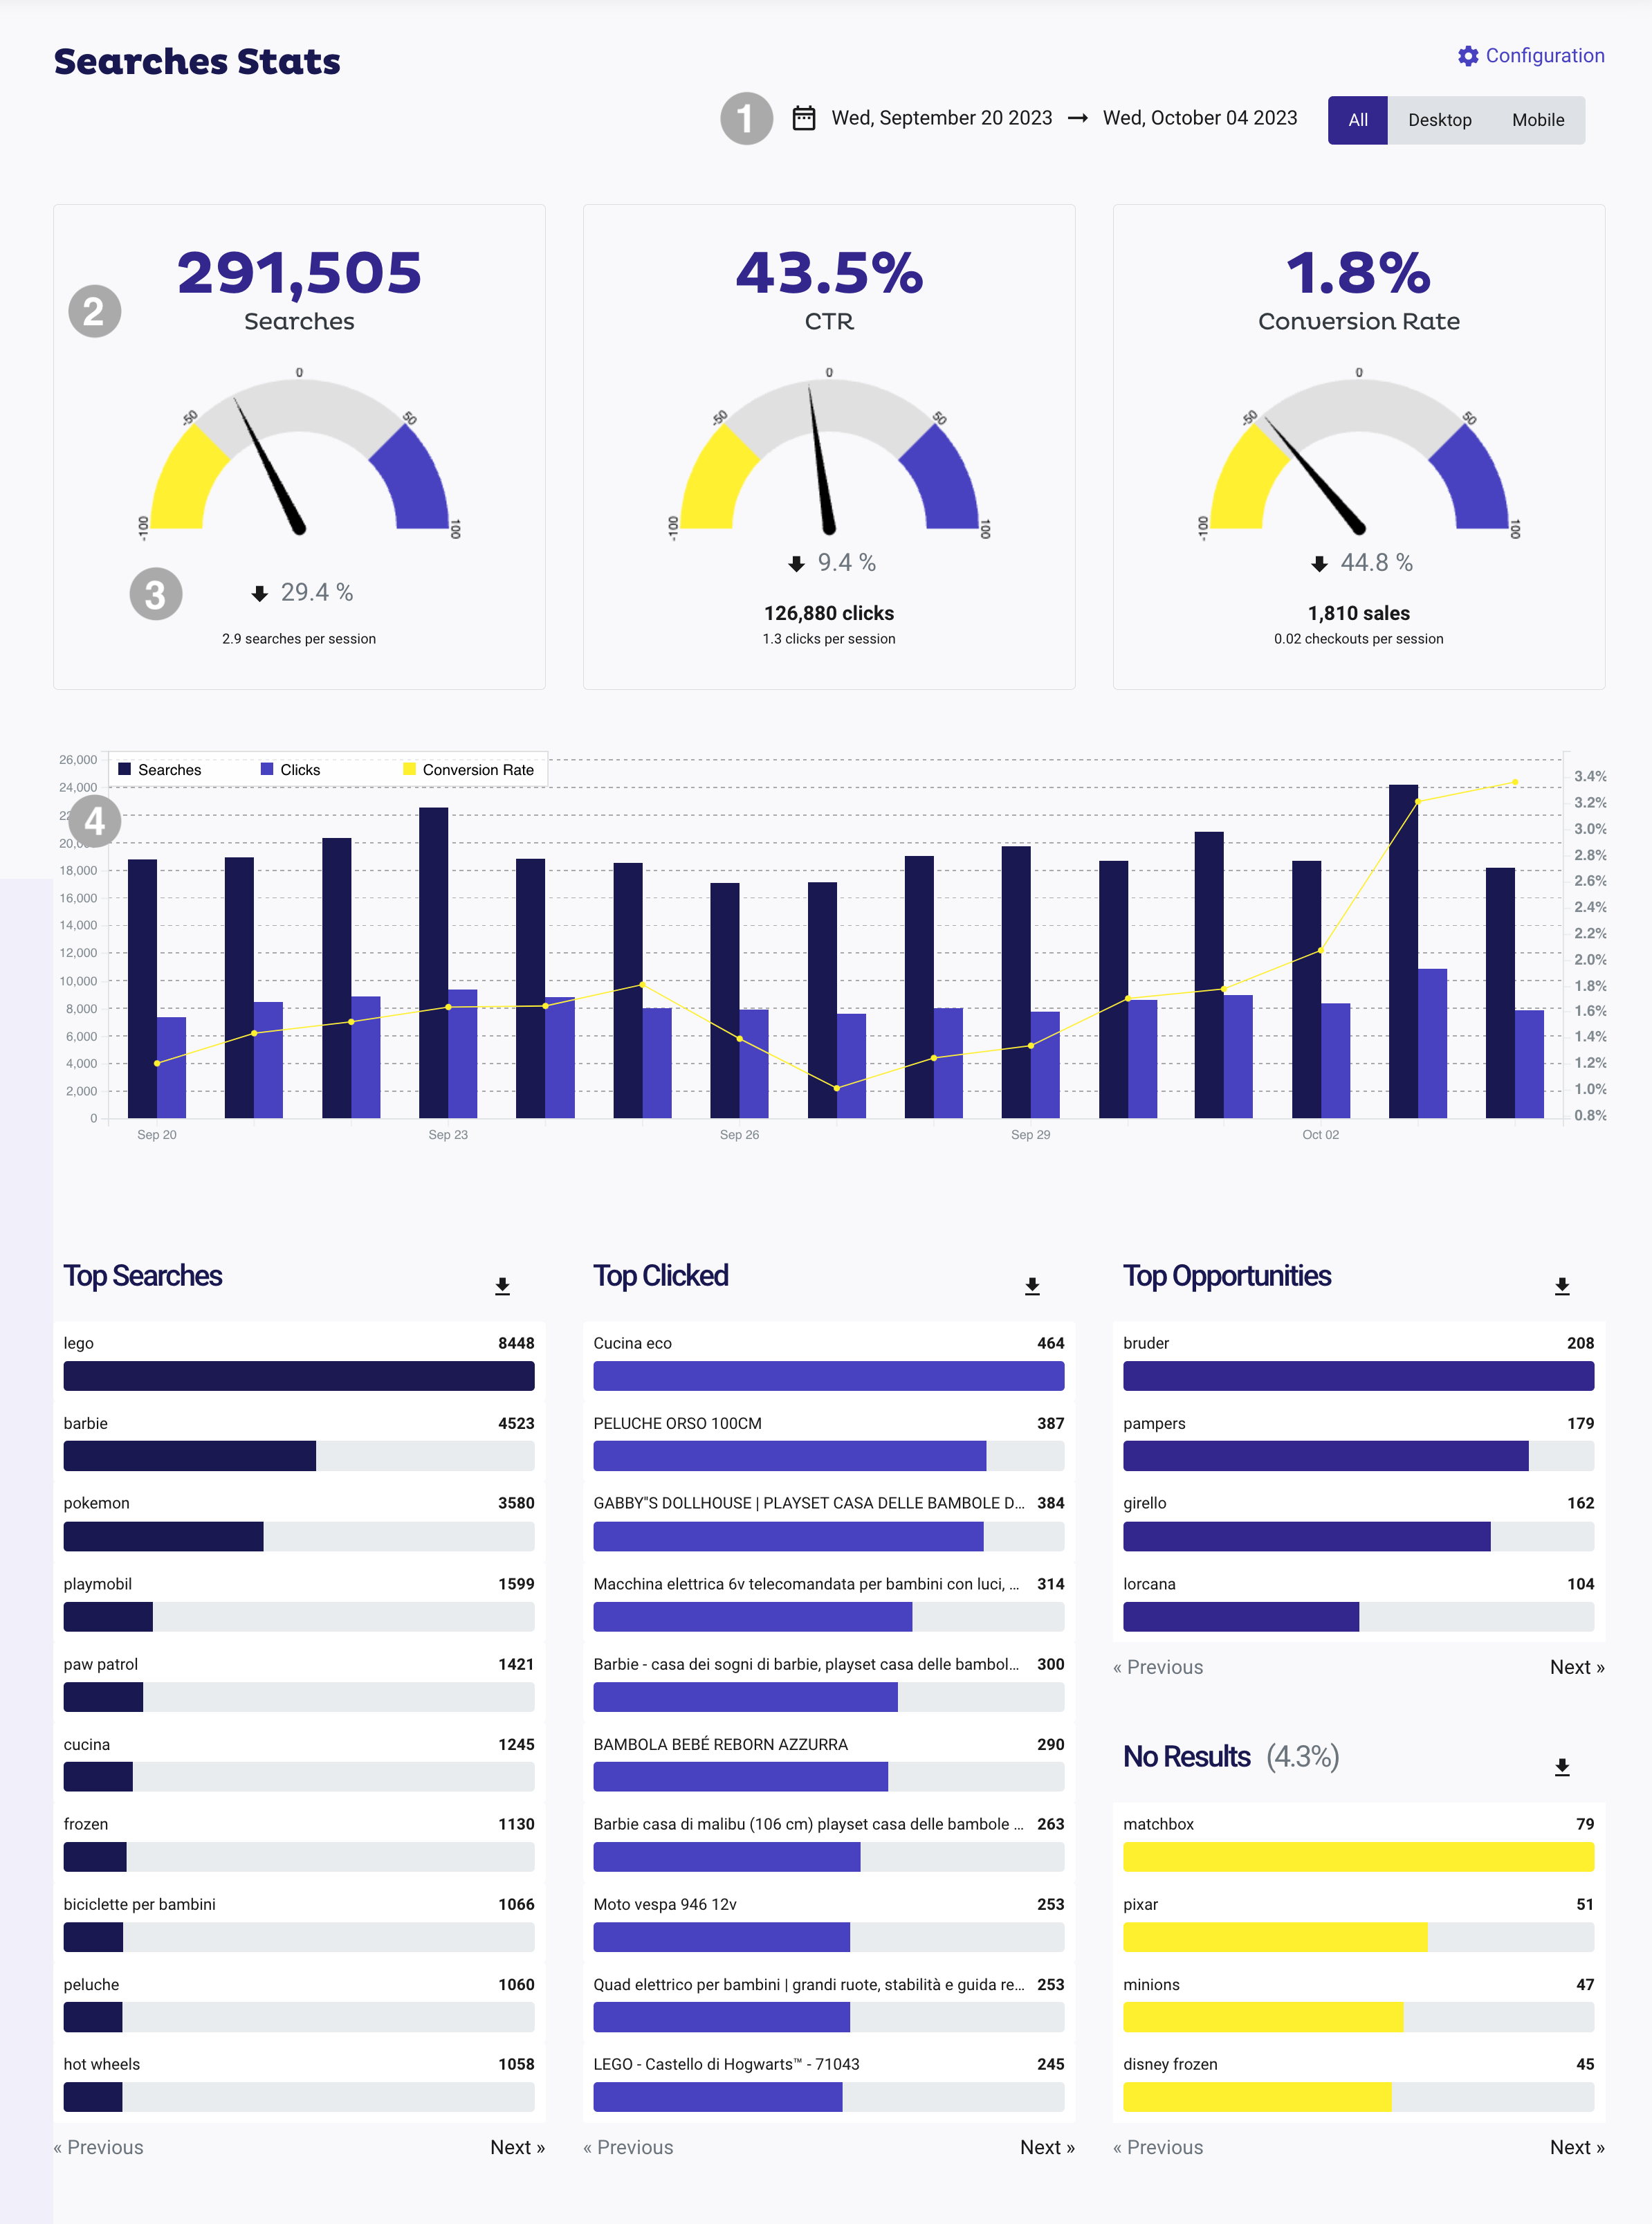
1. Filter Data
You can filter the information by device and date range.
2. Doughnut Charts
SEARCHES: The Searches chart shows the number of searches resolved by your search engine in a given period.
CLICK-TROUGH RATE (CTR): The Click-through rate is the proportion between the number of clicks on the results and the number of searches performed.
CONVERSION RATE: The Conversion rate chart shows the searches' ratio that reaches a certain goal (usually, a sale after searching with Doofinder). The Conversion Rate Configuration article provides further information on this.
3. Percentage
This figure indicates a percentage change between a given period and the same past period.
4. Line Chart
The line chart shows the evolution over time of the doughnut charts.
Searches, Clicks And Opportunities
'Top Searches' are the terms most searched for by your customers, 'Top Clicked' shows you where your customers click the most, and 'Top Opportunities' are results returned by Doofinder, even if there is not a perfect match in the catalog. Thanks to its NLP technology, Doofinder can understand what consumers are looking for by identifying synonyms and filtering out typos.
You can check the results delivered by those terms, adding synonyms or creating custom results to point your customers to the most accurate results.
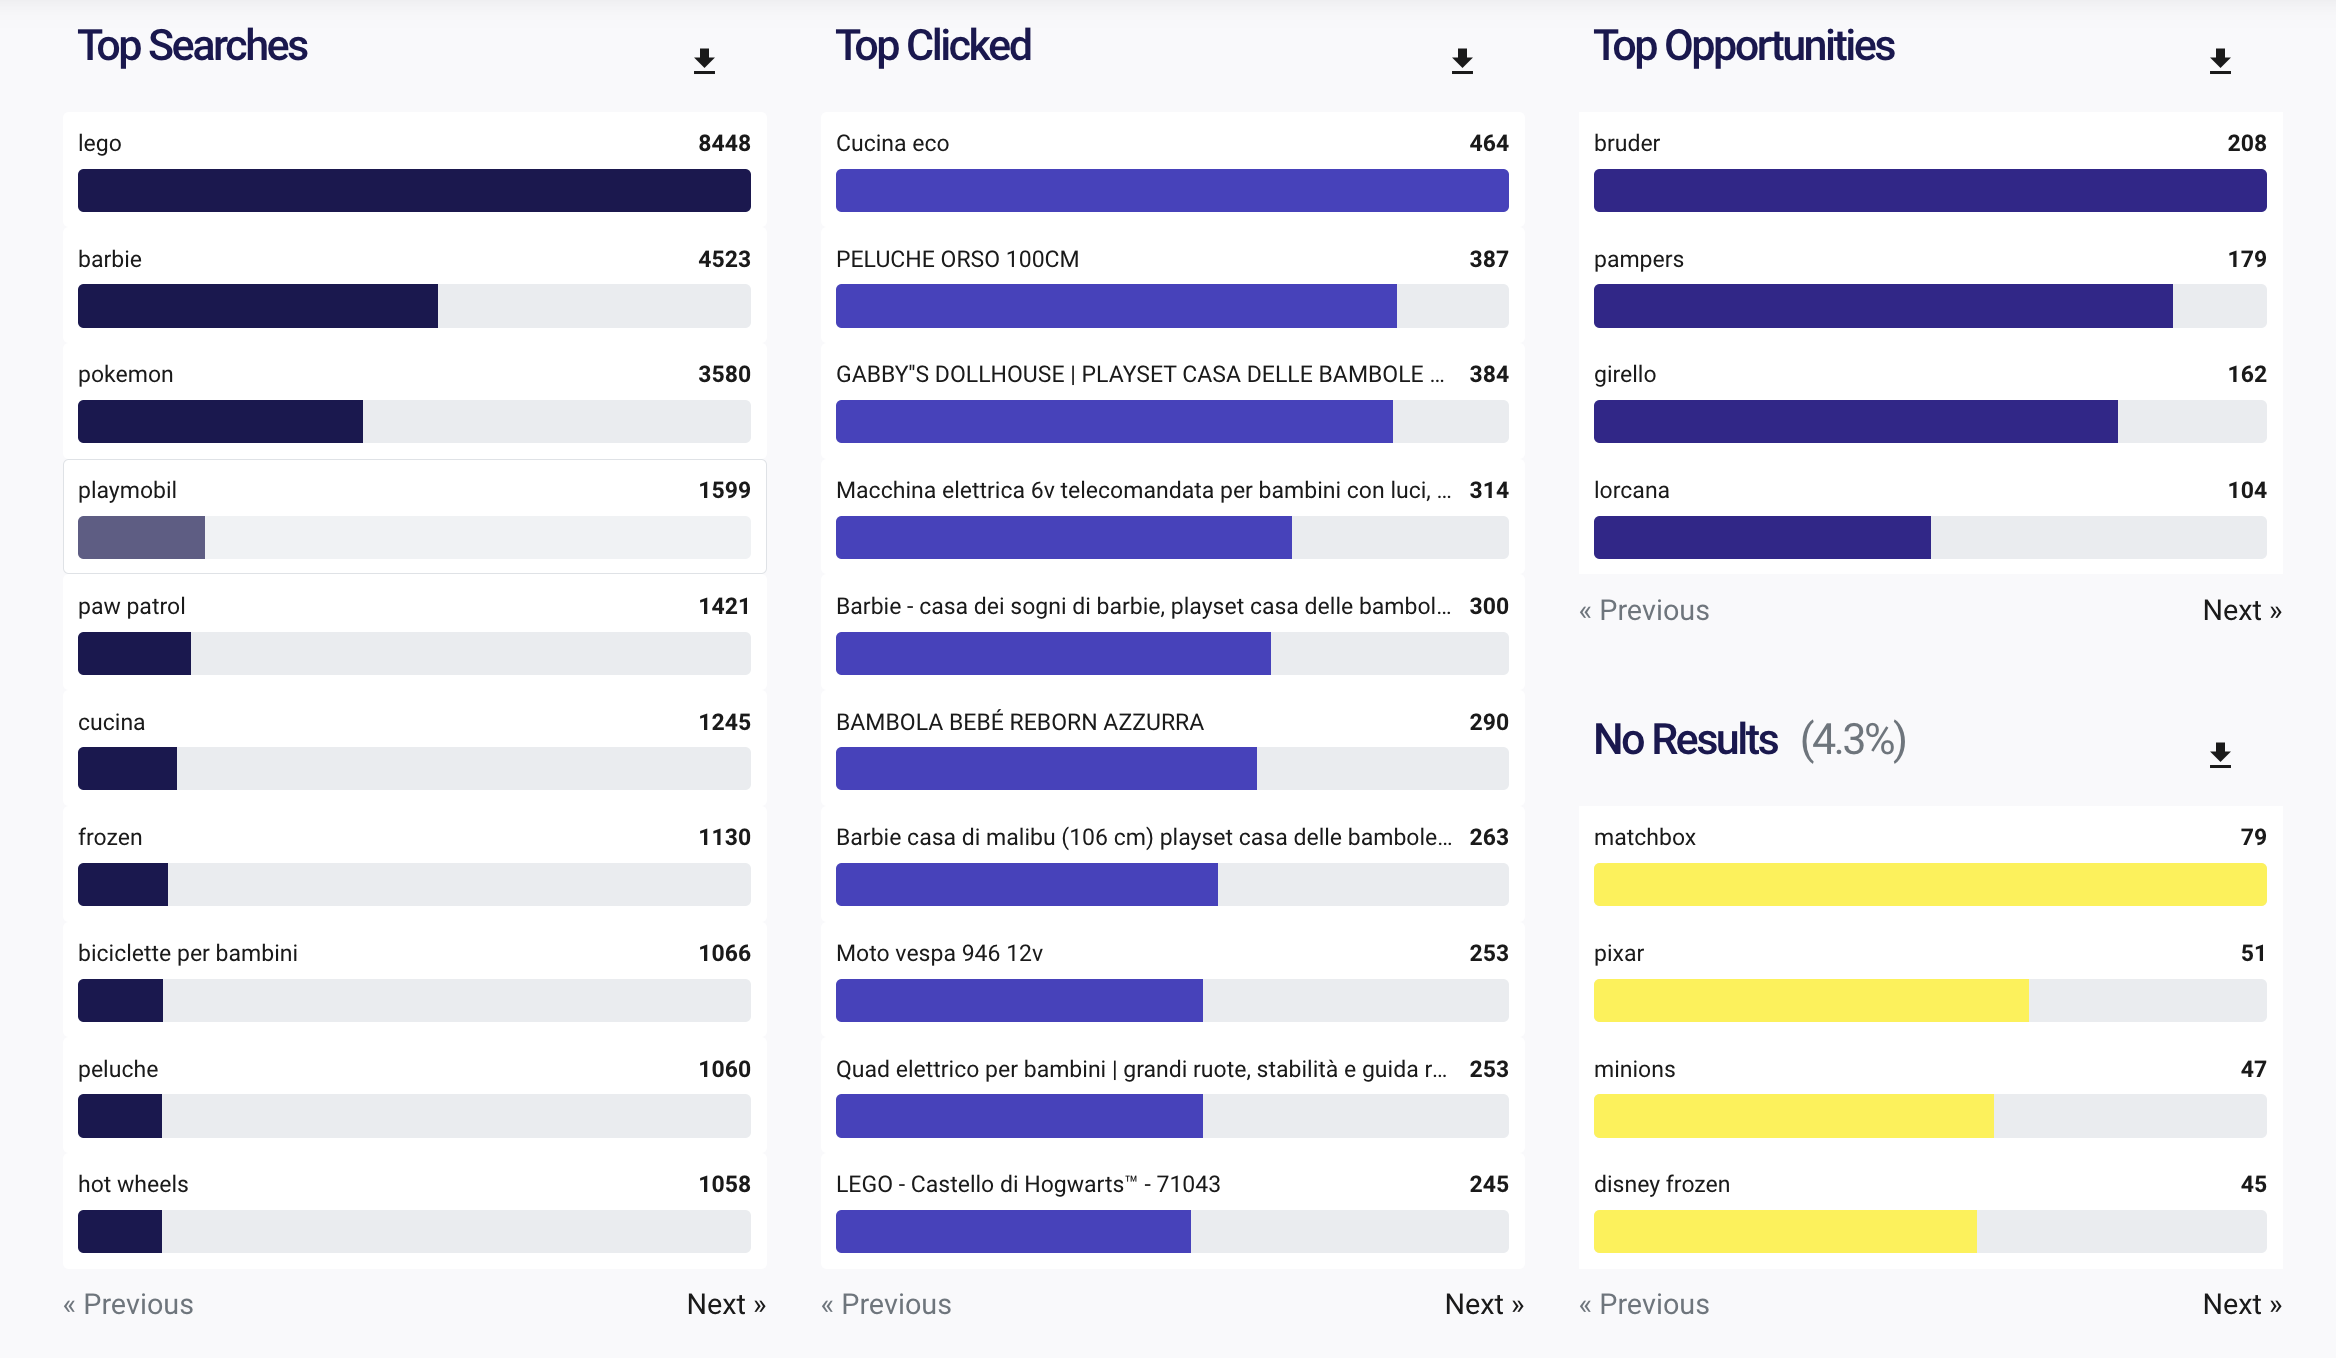
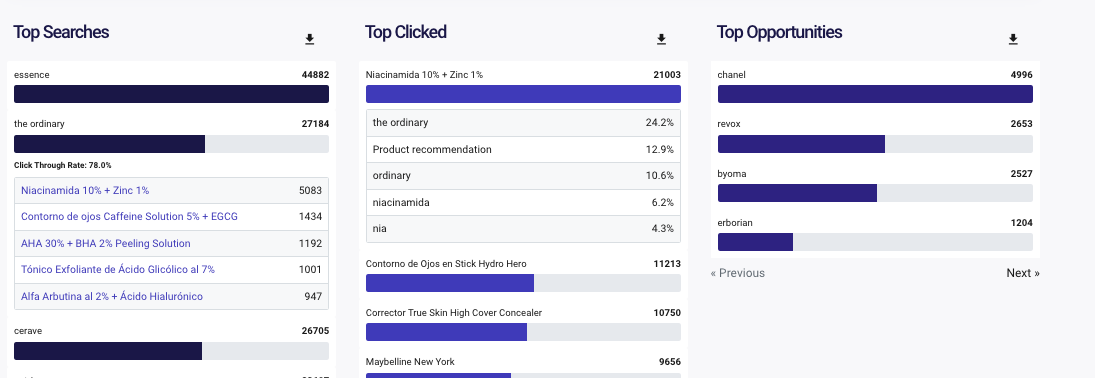
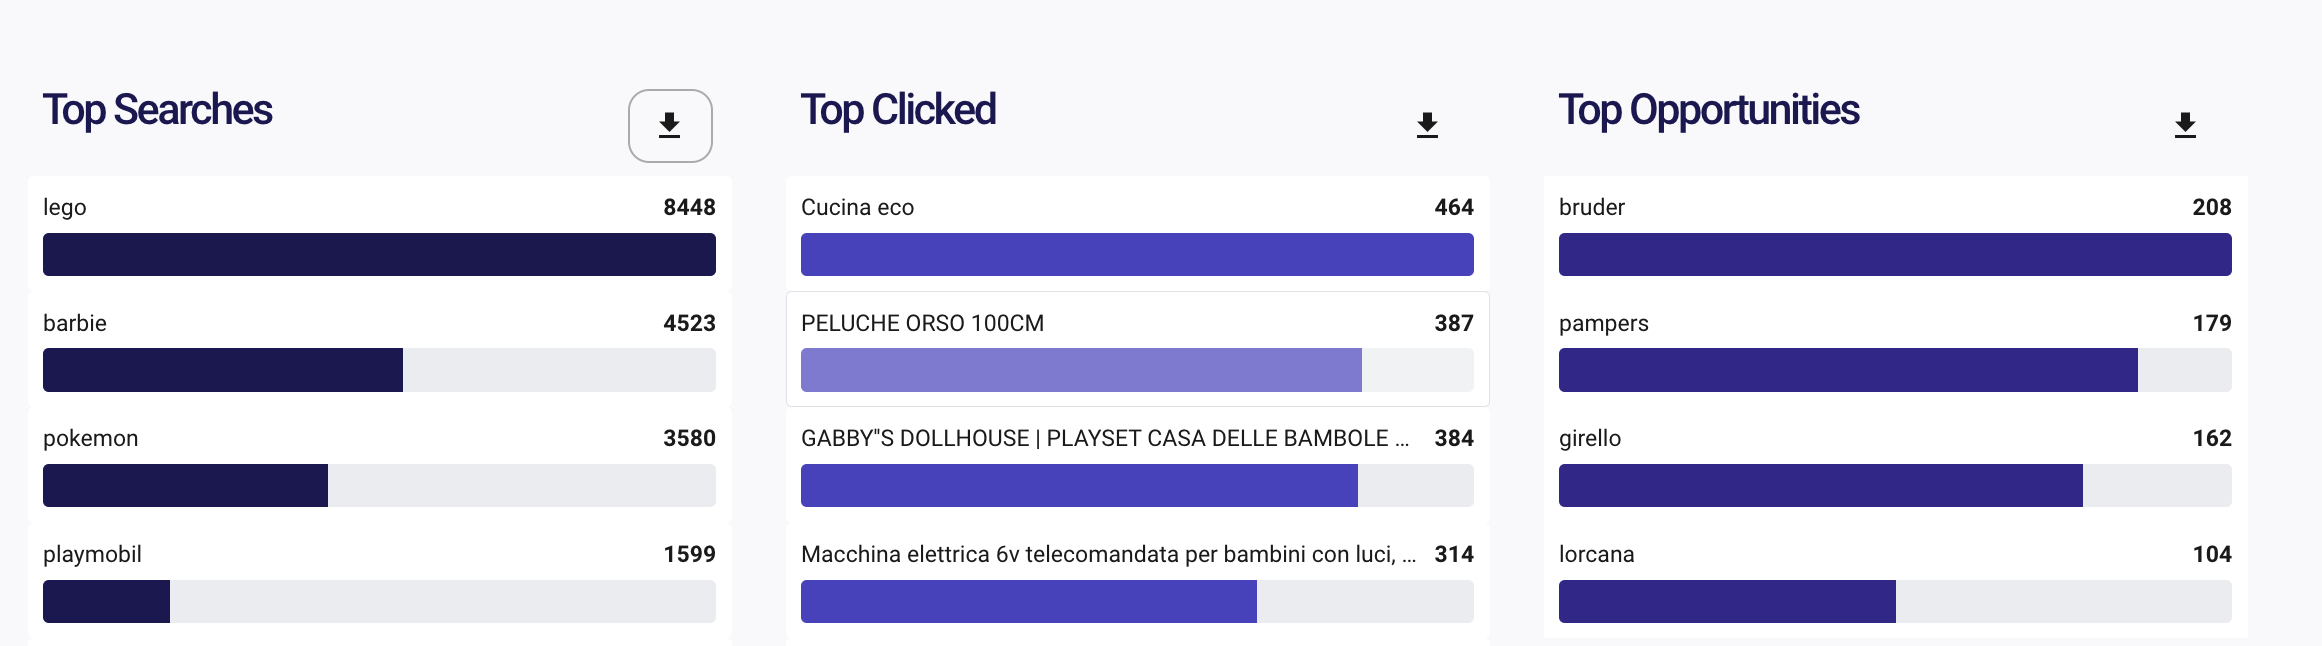
By clicking on the 'bar' you can display more information related to that specific result and the terms your customers are using or, in the case of "Top Clicked" the most clicked products. When the "Product Recommendation" label is shown, it denotes clicked products that do not have an associated search query.
You can download the top searches, clicks and opportunities information by clicking on the arrow next to the title.
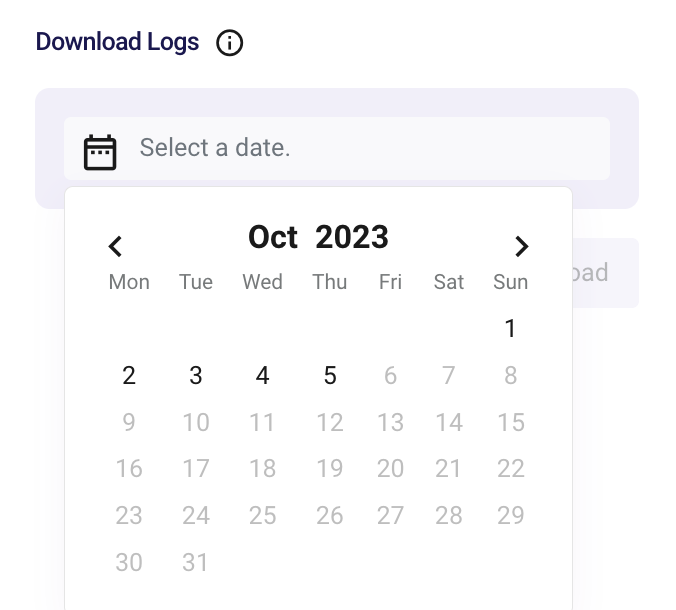
Download Logs
Click on the Configuration icon at the top-right side of the stats page. There you will find a small form to download daily search logs in case you need them for security purposes.
Select the date and click on "Download". You will receive an e-mail with the log information.
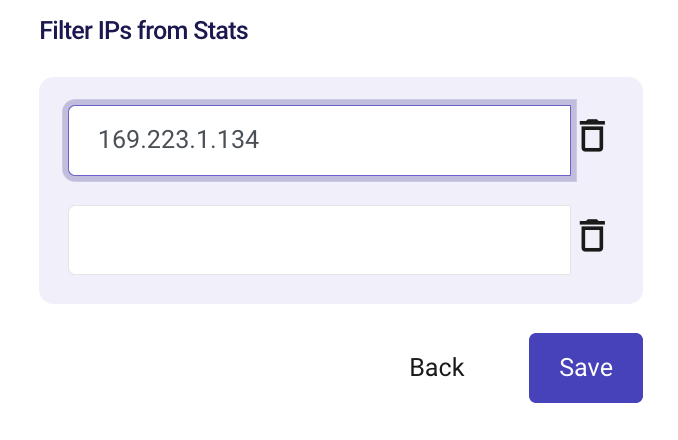
Filter IPs
You can filter the IPs from the statistics so that they do not interfere with the results, by clicking on Configuration at the top-right side of the stats page, type the IP address and save.
The filter takes effect from the day it's added. So, if you add an IP today, previous searches made with that IP won't be removed from the stats.
Filtering IP addresses for statistics requires the public internet address. Exclusion is limited to IPv4 addresses only.
You can filter IPs for statistics analysis only, but they will still count for your consumption, as they are performed and resolved by our service, whatever the source.
To delete and address, click on the trash icon and save.
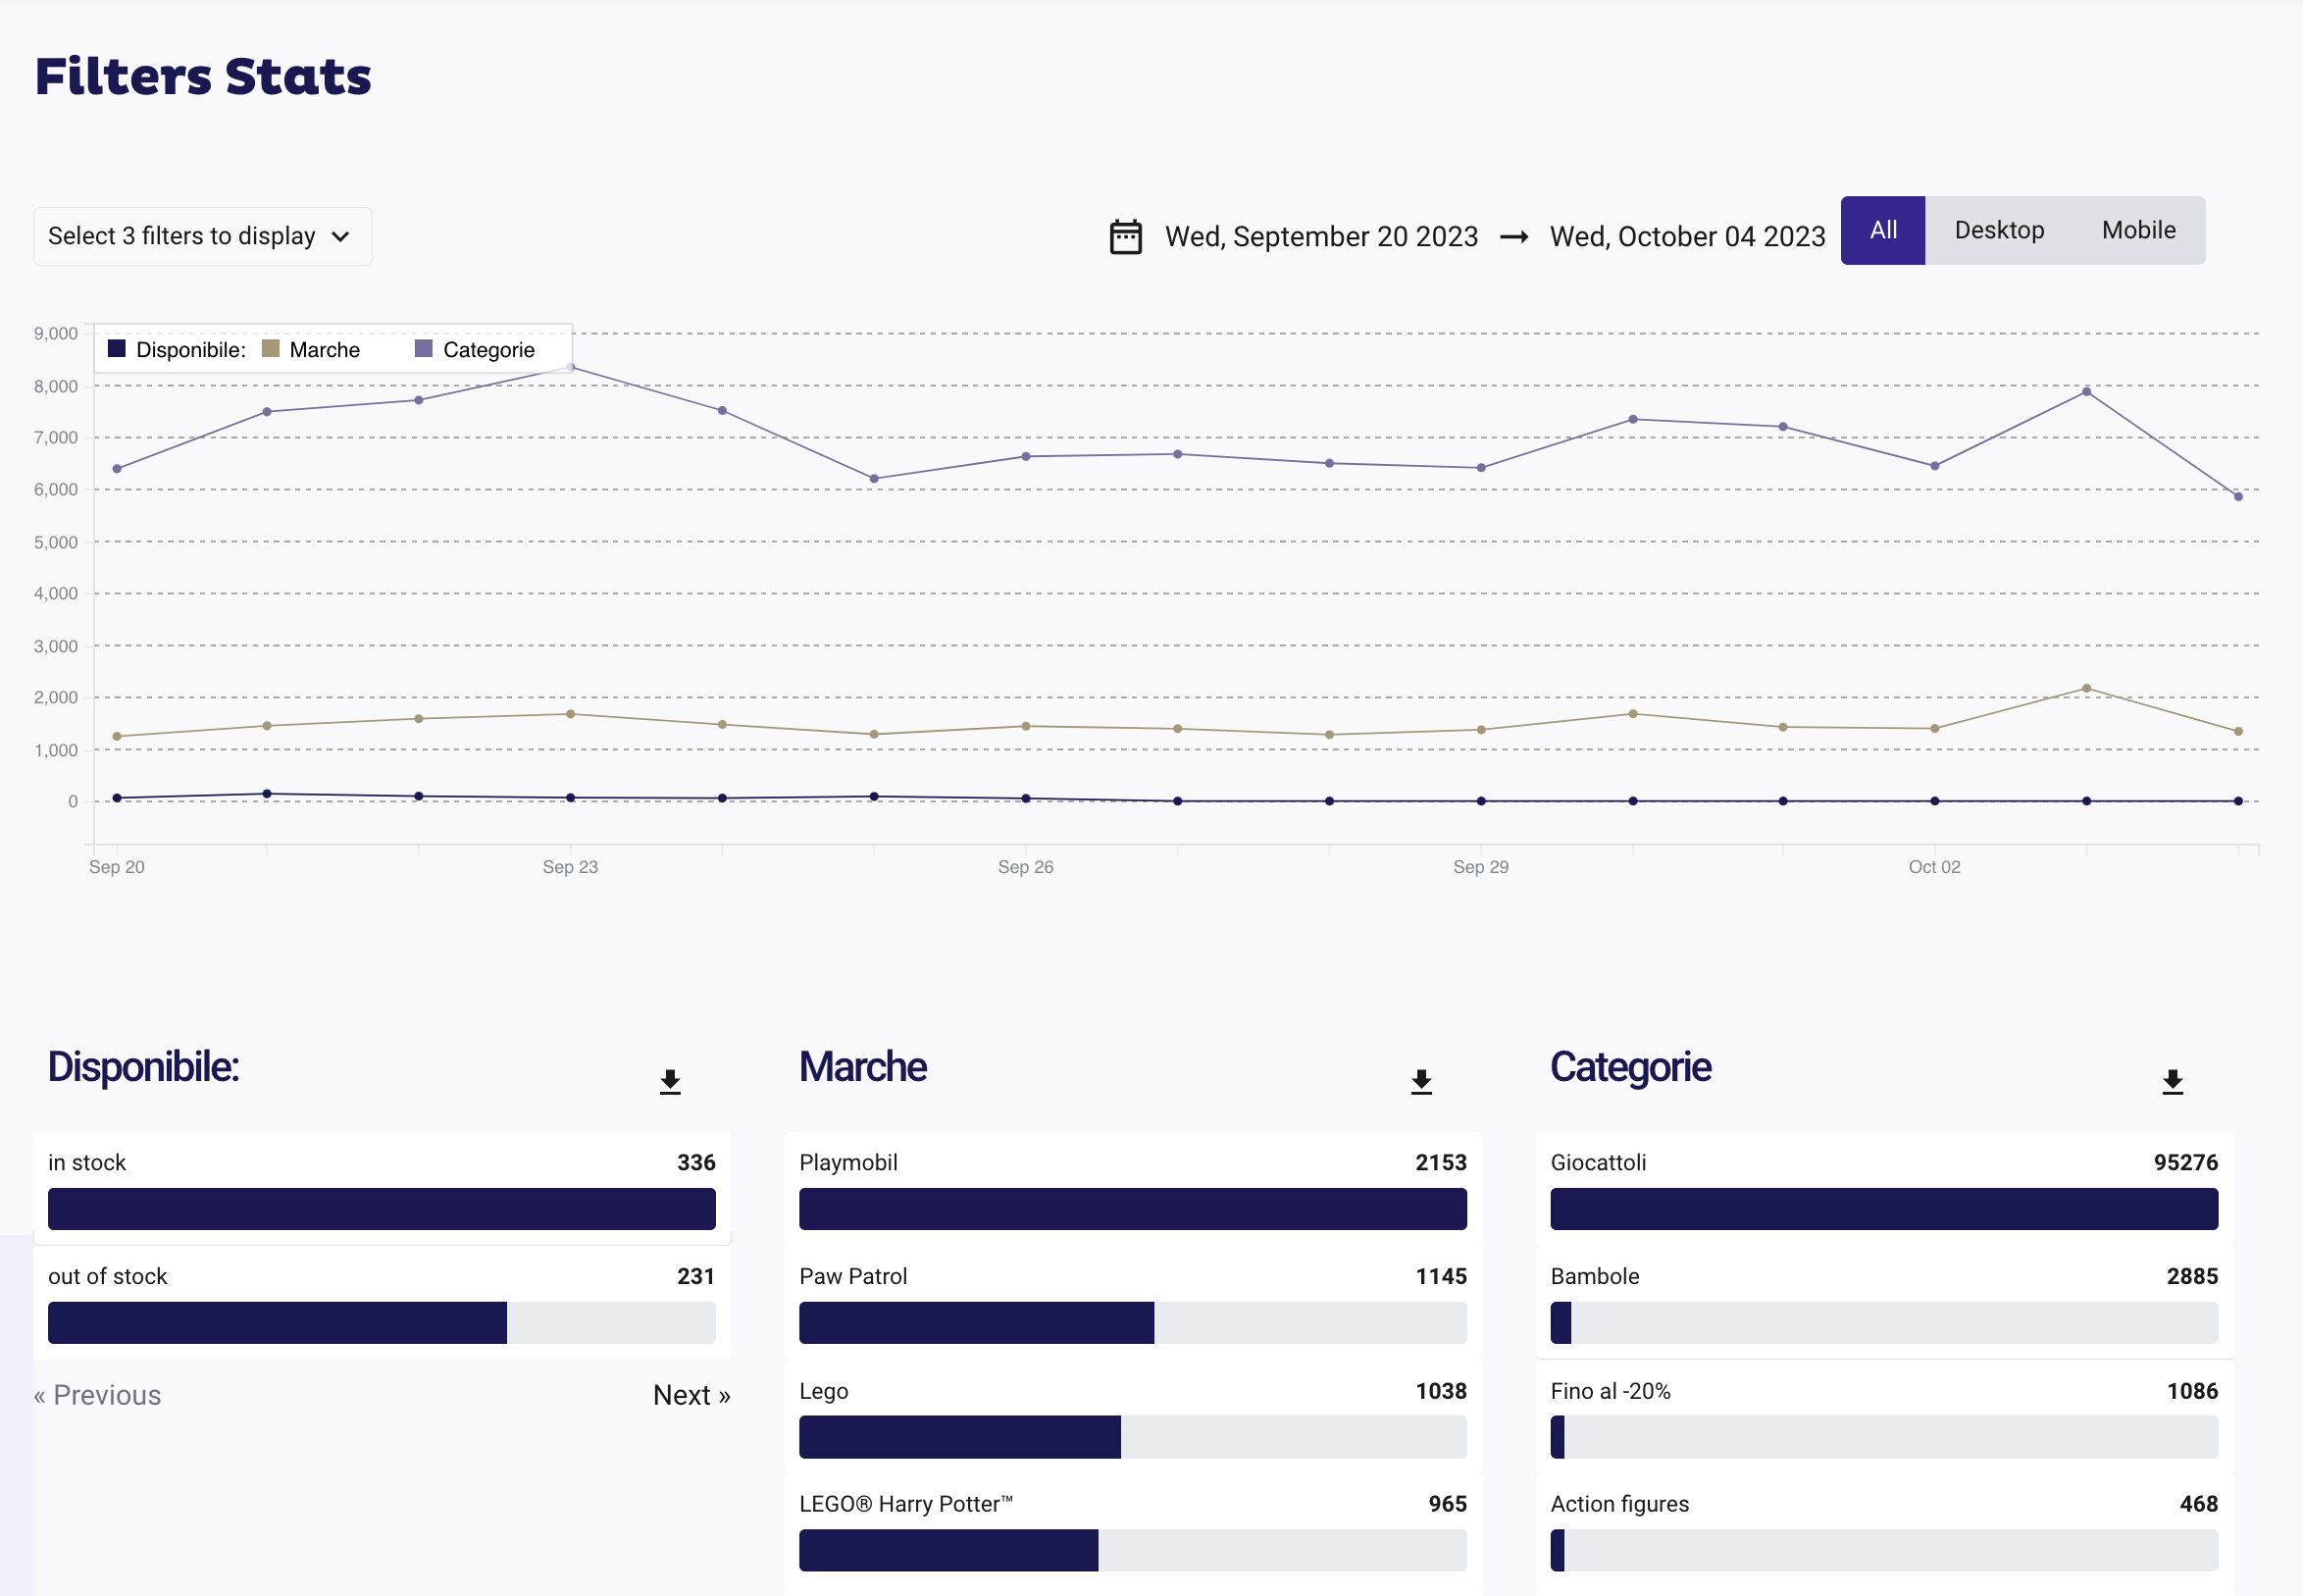
Filter Stats
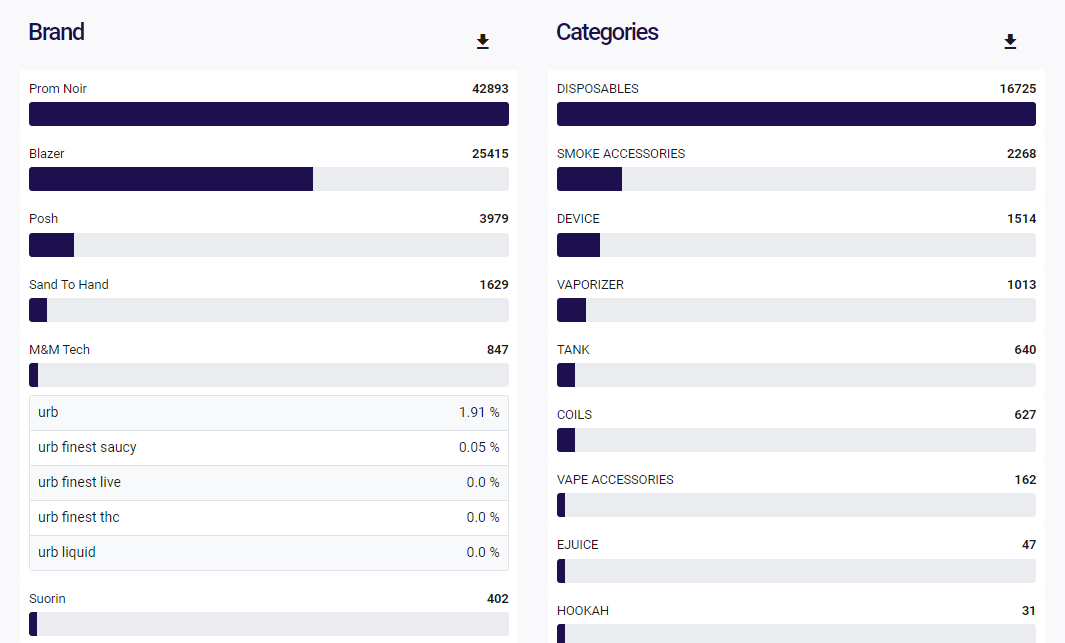
The statistics tool is also applied to your filters, allowing you to obtain more relevant results according to your filters. The data can be compared across filters, as shown in the chart below, by clicking on the drop-down menu and selecting the options.
For instance, in the image below, are the searched terms along with their associated filters. In this snapshot, the Brand filter's value, "M&M TECH," recorded 847 clicks. Notably, in 1.91% of instances, these clicks were associated with the search term 'urb.'
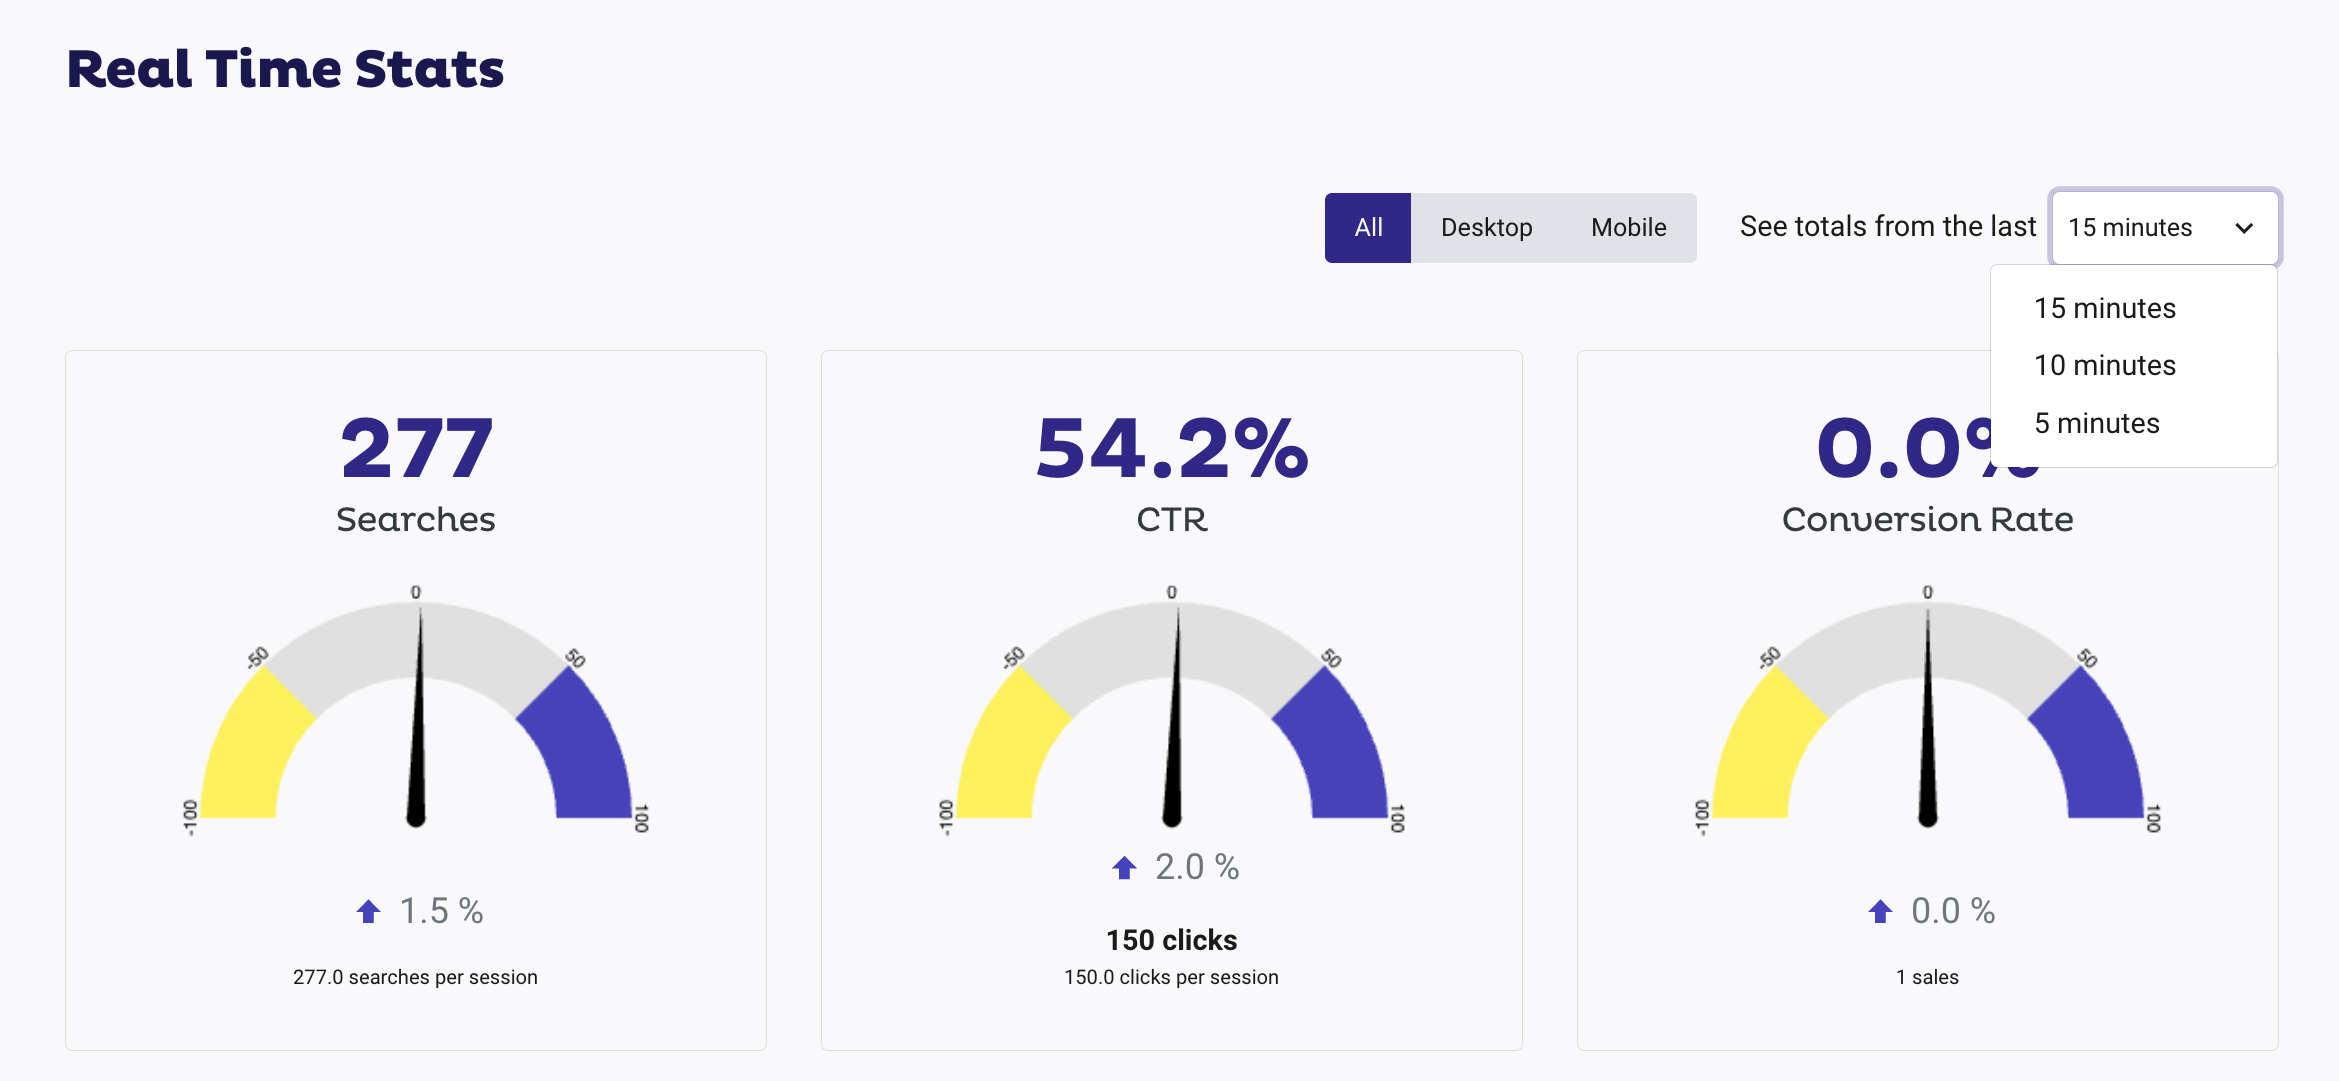
Real Time Stats
See the total number of searches, compare clicks, CTR and more, updated in real time, as well as information on where they originate (geolocation).
You can select the real time range to view the information on your screen.
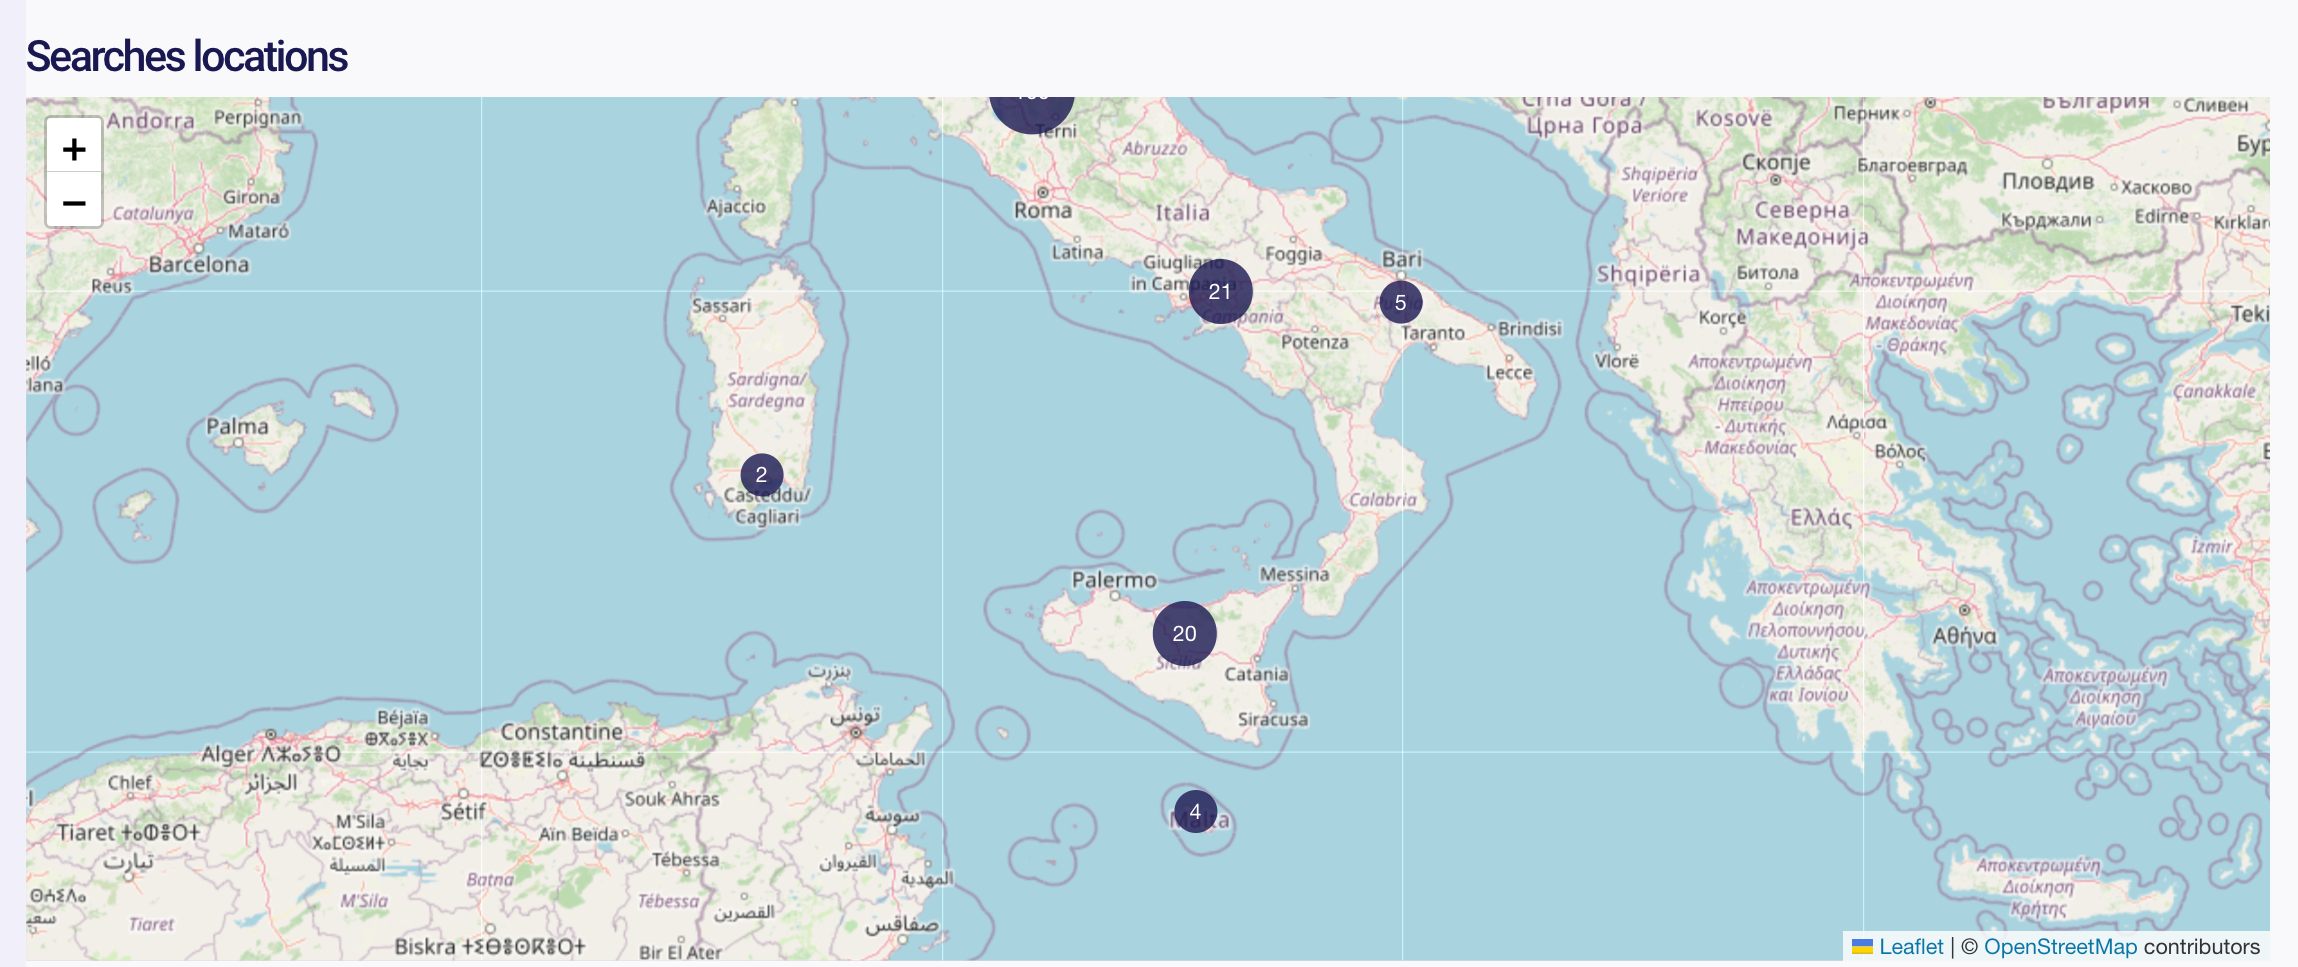
Using geolocation, you can see, in real time, where customers are buying from.
Doofinder is GDPR-compliant.