The Analytics of your AI Assistant gives you a clear view of how your AI Assistant performs in your store to understand engagement and make space for improvement.
How to View Analytics
To access this section, from your Doofinder admin you can go directly from the home page, clicking on the Analytics section or, navigate to your Doofinder Admin > AI Assistant > Analytics. Make sure you are on the correct store and search engine before reviewing the data.
At the top of the Analytics page, two filters control all the data displayed:
- Use the device selector to filter by All devices, Desktop, or Mobile.
- Use the date picker to select the desired period to compare data.
Quick reference
| Metric | What it measures |
|---|---|
| Conversations | Total number of AI Assistant conversations initiated during the selected period. |
| CTR (Click-Through Rate) | Percentage of AI Assistant interactions that led to a product click. |
| Conversation-driven sales | Total revenue generated from purchases attributed to AI Assistant conversations during the selected period. |
| CR (Conversion Rate) | Percentage of AI Assistant interactions that led to a completed purchase. |
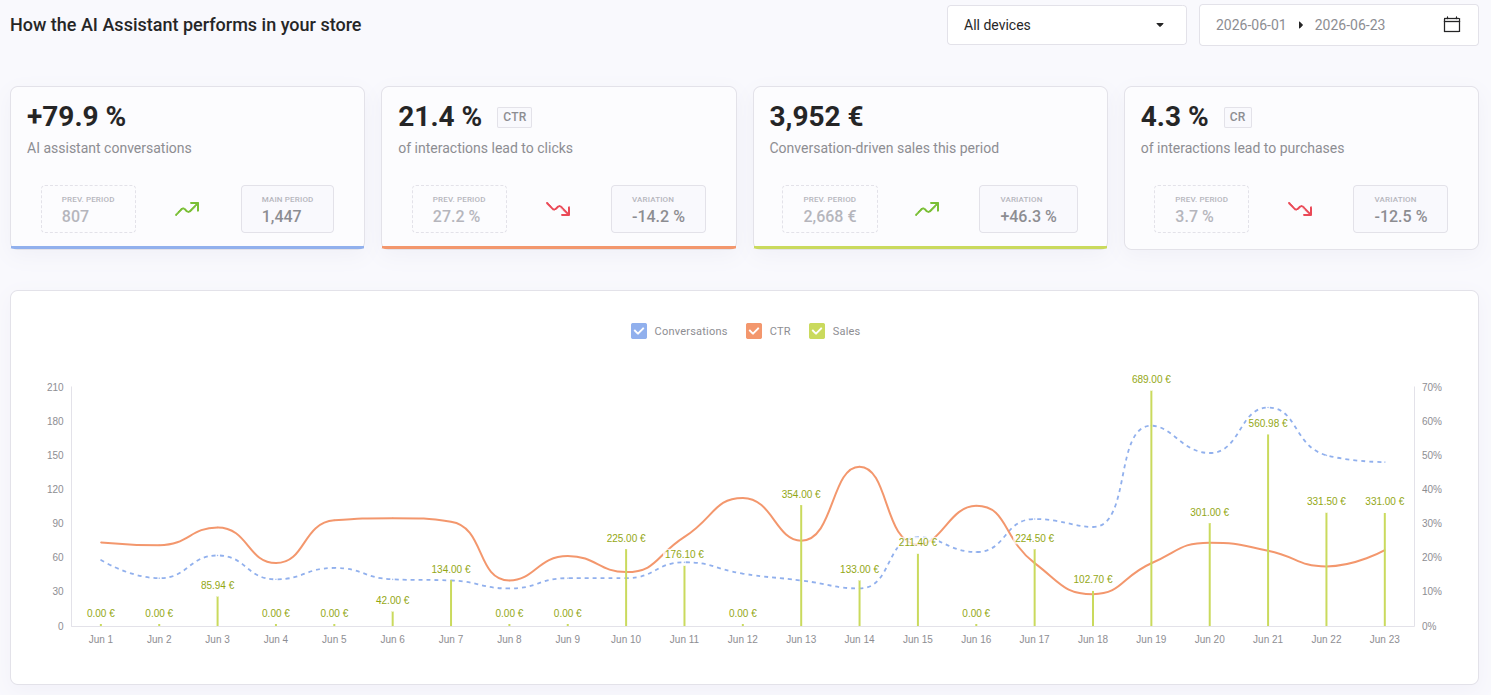
Each Analytics card displays:
- Current period value.
- Previous period value.
- Variation vs. previous period (percentage change with a directional arrow).
A downward arrow on Conversations or CTR indicates a drop compared to the previous period. On the other hand, an upward arrow on CR indicates improvement.
Statistics Graph
The line chart below the metric cards visualizes day-by-day trends for the selected period. Three metrics can be turned on or off using the legend at the top of the chart:
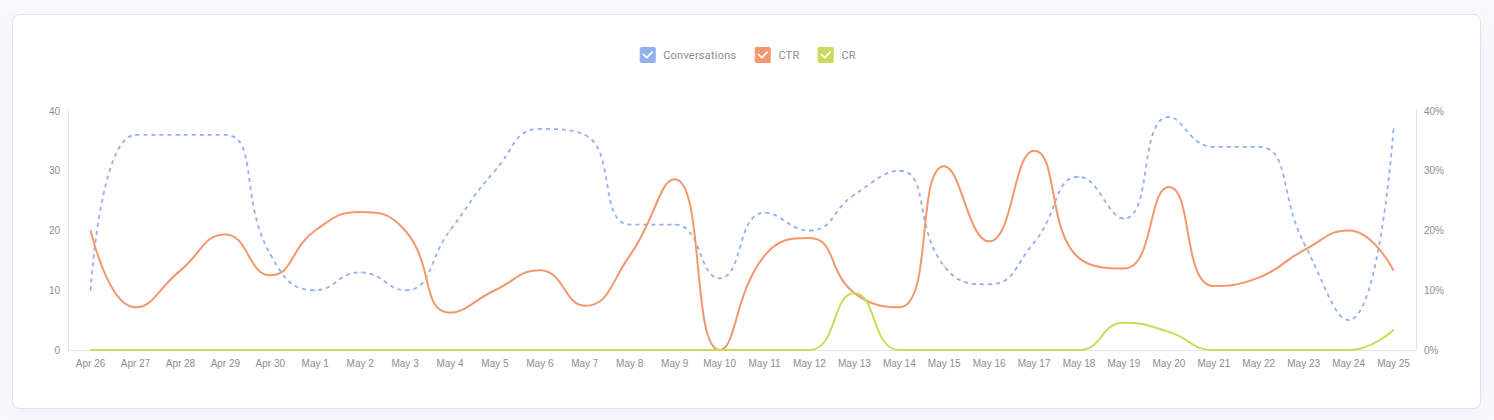
- Conversations trend lines (blue colored).
- CTR (orange colored).
- CR (green colored).
Use this chart to identify patterns like spikes, campaign impact, seasonality or drops in engagement over time. Hovering over a specific date shows the values for that day.