Overview Stats
The Stats page inside the Category Merchandising provides a complete view of how this product contributes to engagement and sales. In this section you will learn about your stats.
How to View Stats
Firstly, make sure to set up the page with the necessary info to see the correct numbers:
- From your Doofinder admin you can directly access it from the home page, clicking on the Analytics section or, navigate to the Category Merchandising icon on the left hand side menu > Analytics:
- At the top bar of the page you can select your store and search engine.
- On top of the stats, you can filter the data using:
- The device selector: options include all devices, desktop or mobile.
- A calendar: choose the date range which you’d like to view the statistics.
- Main period: the previous period adjusts automatically with the same date range.
- Previous period: the main period remains fixed as you may want to compare the previous period with the main period as it is.
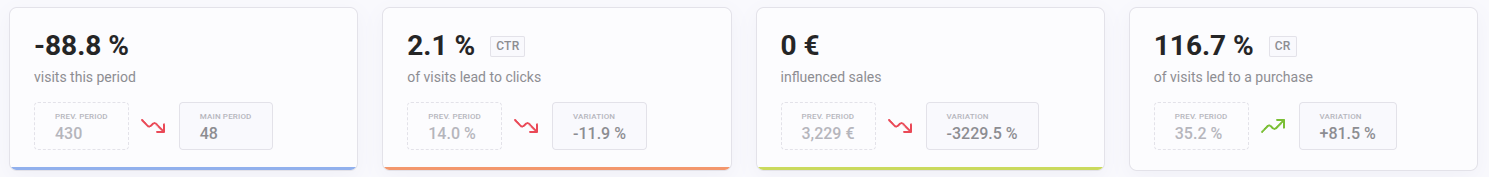
- Once that’s defined, you will see that your stats show the information based on your filters, see example table below:
| Metric | Shows | Information on Hover |
|---|---|---|
| Views | Total number of category page views. | - Current traffic sessions - Previous traffic sessions - Percentage of shoppers visiting category pages - 6-month average of category page views |
| Click-Through Rate (CTR) | Engagement rate. The balance of total product clicks from category pages and total category views. |
- Total clicks for current period - Total clicks for previous period - 6-month average clicks |
| Sales | Total checkout value from sessions that included a category view. | - Percentage of total sales coming from category sessions - Average order value - 6-month average order value |
| Conversion Rate (CR) | Category visits leading to checkout in the same session. Balance of number of checkouts after category visit and total category page views. |
- Total orders for current period - Total orders for previous period - 5-month average orders |
Each of the cards displays:
- Current value
- Previous period value
- Change vs previous period (if available)
- Trend arrow
Statistics Graph
This chart will allow you to visualize trends over time. It also displays the day-by-day performance within the selected main period.
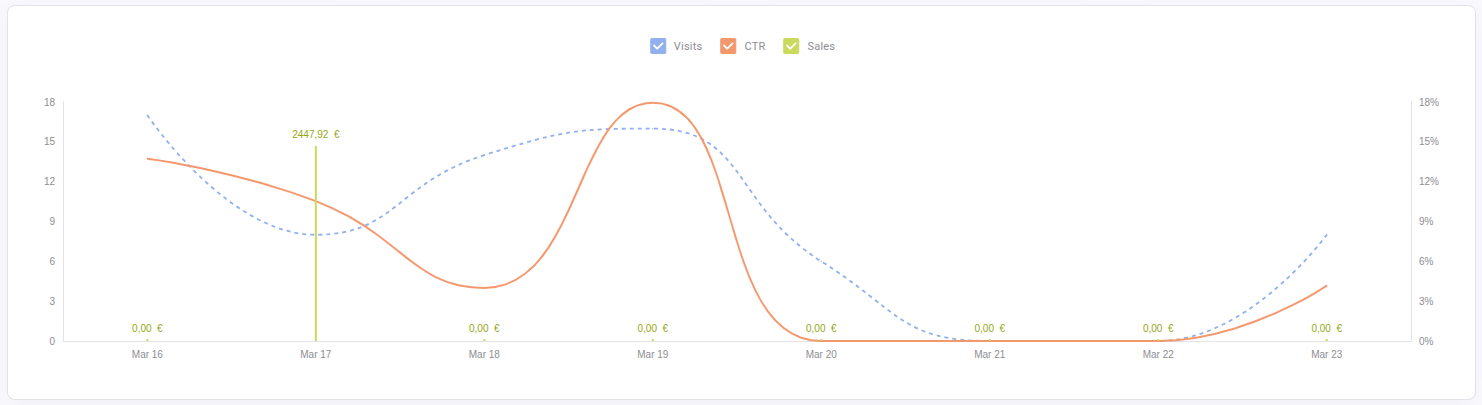
Available metrics on the chart upon selection: Visits (when the carousel load, then a visit is registered), CTR and Sales.
Users can:
- Switch between metrics.
- Compare time periods.
- Use the same visual and interaction patterns as Search/Category Stats.
This section helps identify seasonality, campaign impact, or performance drops.
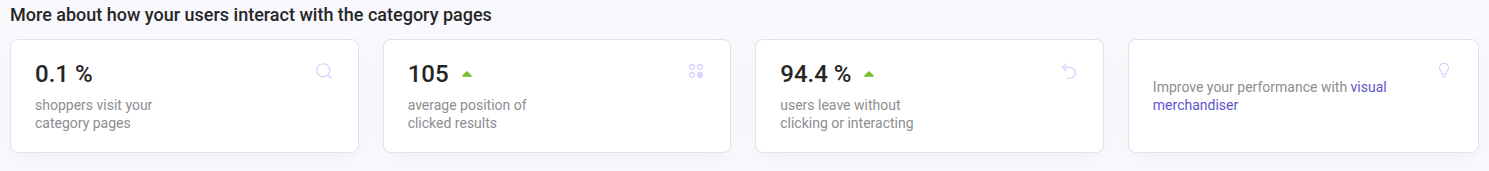
More about how your users interact with the category pages
On the following stats table, you can get information that shows additional contextual metrics:
| Metric | Shows | Information on Hover |
|---|---|---|
| % of shoppers visiting category pages | The balance of total unique sessions visiting category pages and total sessions. | - Previous period. - 6-month usage. - Share of total store sessions using category pages. |
| Average position of clicked results | Average position of products users click on. | - Previous period. - 5-month average. - How far users need to scroll before finding something worth clicking. |
| % of users leaving without interaction | Balance of the Category page visits without clicks and total category page visits. | - Previous period. - % of times users visited a category page but left without clicking on any result. High value may indicate irrelevant items or poor ranking. |
| Visual Merchandiser | Boost your category performance by pinning key products. | - Click here(link) to learn about the Visual Merchandiser. |
Category Page breakdown
At the bottom of the page, a detailed table provides performance data for each Category Merchandising page built.
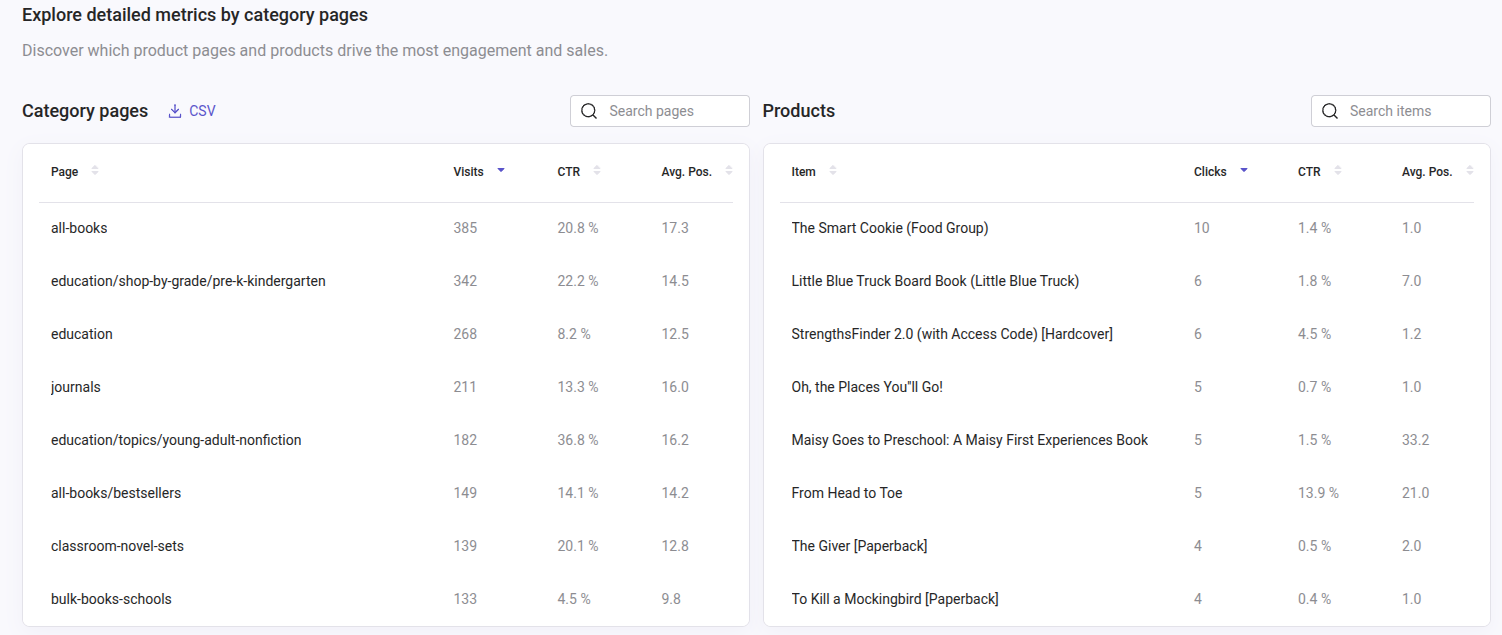
The table Columns include:
- Category Page Name (this is the filter value applied - e.g. /men/accessories)
- Visits
- CTR
- Average Click Position
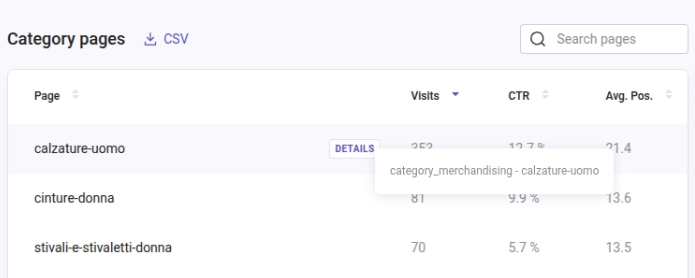
On the table Category pages, if you hover the mouse over the Category Page Name you will see displaying a button called “DETAILS”:
When clicked this button will open a second table on the right side, with the products clicked in that category page and the columns clicks, CTR and position, see:
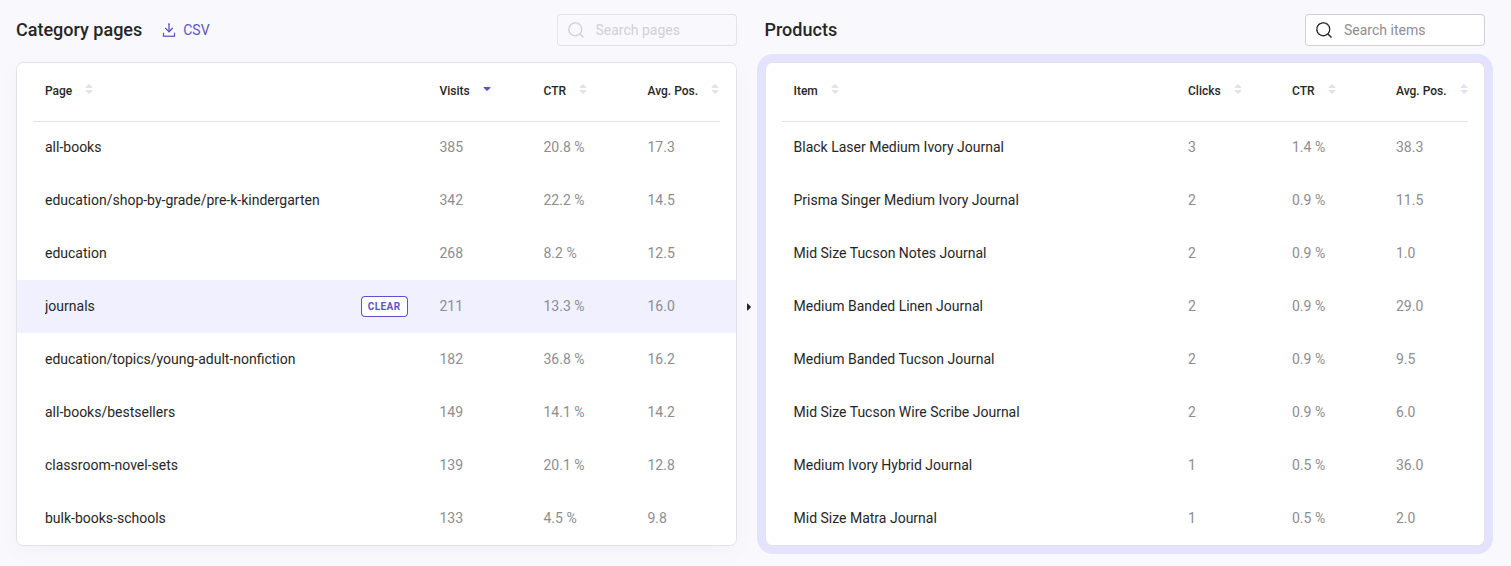
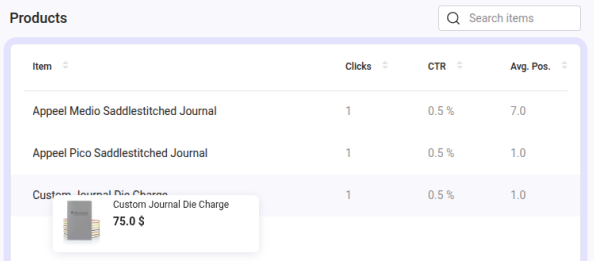
In the secondary table called Products, you will see all products from that Category page previously hovered over. Now, hovering a product will show a tooltip with a summary of the product:
Download Stats Reports
You can download detailed CSV reports for deeper analysis. However, notice that there is a defined limit that permits data to be downloaded for a maximum period of three months.
Click the CSV button, a download link will be sent to your email.
When downloading the Category pages CSV, you will have access to:
| Column | Description |
|---|---|
hashid |
Identifier of the Search Engine. |
page_url |
URL of the page. |
total_visits |
Total number of times the page has been visited. |
total_clicks |
Total number of clicks performed on the page. |
page_CTR |
Overall click-through rate of the page (clicks / total searches). |
page_avg_click_position |
Average position of clicks on the page, weighted by the number of clicks. |
clicked_product_ids |
IDs of products clicked (can be separated by ;). |
clicked_product_names |
Names of products clicked, in the same order (can be separated by ;). |
clicked_product_link |
URLs of products clicked, in the same order (can be separated by ;). |
product_clicks |
Number of clicks per product, in the same order (can be separated by ;). |
product_avg_position |
Average position per product (can be separated by ;). |
Downloading the Products CSV will provide information about:
| Column | Description |
|---|---|
hashid |
Identifier of the search engine. |
clicked_product_ids |
ID of the clicked product. |
clicked_product_names |
Name of the product. |
clicked_product_link |
URL of the product. |
product_clicks |
Total number of clicks on this product for that search. |
product_CTR |
Click-through rate of the product within that search (clicks / views). |
product_avg_position |
Average position where the product appeared when clicked. |
page_url |
URLs of the pages where the product was clicked (separated by ;). |
total_visits |
Total number of times each page was visited (separated by ;). |
total_page_click |
Total number of clicks on the product performed on each page (separated by ;). |