The Stats page inside Recommendations provides a complete view of how recommendation widgets contribute to engagement and sales. In this section you will learn about your stats.
How to View Stats
From your Doofinder admin you can go directly from the home page, clicking on the Analytics section or, navigate to the Recommendations on the left-hand side menu and click on Analytics, make sure you are on the desired store and search Engine:
- From there, on top of the stats, you can filter the data using:
- The devices selector
- Date picker (controls all data on the page).
- Once that’s defined, you will see that your stats will show the information based on your filter selection. See the table below:
Quick Reference Stats Chart
| Metric | Shows | Information on Hover |
|---|---|---|
| Views (Impressions) | Total number of times a recommendation widget was displayed |
- Current and previous period impressions. - % of sessions with recommendation impressions. - 6-month average impressions. |
| Click-Through Rate (CTR) | Engagement rate: % of users who clicked on a recommended product. It's a balance between total clicks on recommended products and total recommendation views. |
- Current total clicks. - Previous total clicks. - 6-month average CTR. |
| Sales | Total checkout value from sessions that included a recommendation click. |
- Total sales value (current period). - Average order value - 6-month average order value. |
| Conversion Rate (CR) | Proportion of recommendation views that led to a checkout (via a recommendation click in the same session). A balance between the number of checkouts after recommendation click and total recommendation impressions. |
- Total orders (current period). - Previous period orders. - 6-month average CR. |
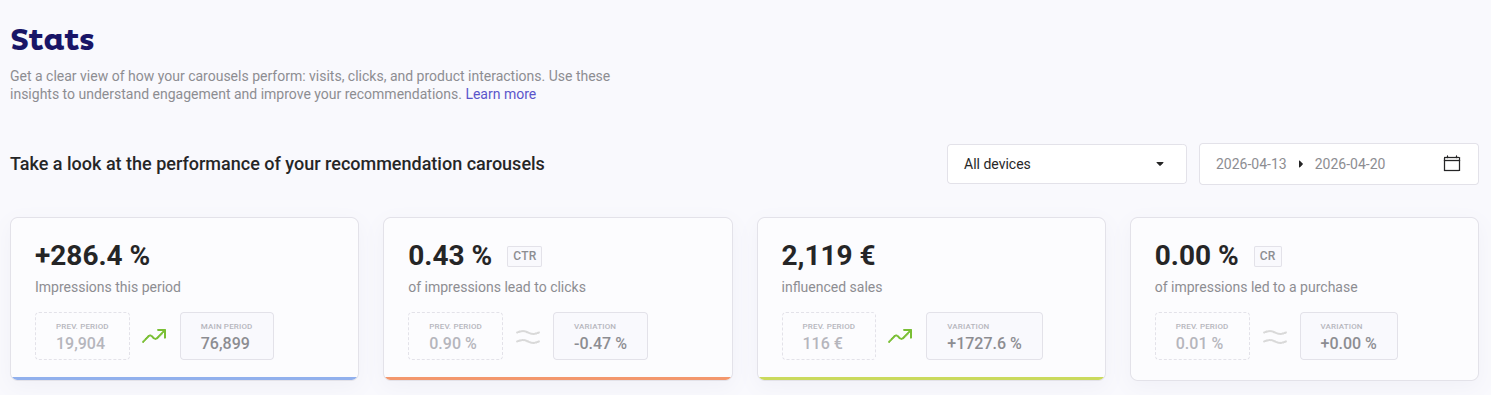
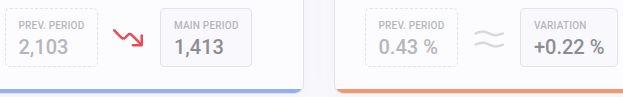
Each of the cards displays:
- Current value
- Previous period value
- Change vs previous period (arrow or % change)
- Trend arrow
How Recommendations Conversion Rate is Calculated
CR (Conversion Rate) is calculated as:
CR = (Attributed Checkouts ÷ Display Sessions) × 100
Example: CR = (8 ÷ 75,000) × 100 = 0.0107% ≈ 0.01%
| Metric | Value |
|---|---|
| Widget | Our Recommendations |
| Impressions | 142,300 |
| Unique sessions that saw the widget | 75,000 |
| Checkouts attributed (last-click) | 8 |
| CR (8 / 75,000 × 100) | 0.0107% → 0.01% |
- Attributed Checkouts: last-click checkouts attributed to the widget (8).
- Display Sessions: unique sessions that saw the widget at least once (75,000). A session that sees the widget multiple times still count as one.
Impressions count every render, including repeated page loads in the same session, and are not used in the CR formula.
Statistics Graph
This chart will allow you to visualize trends over time. It also displays the day-by-day performance within the selected period.
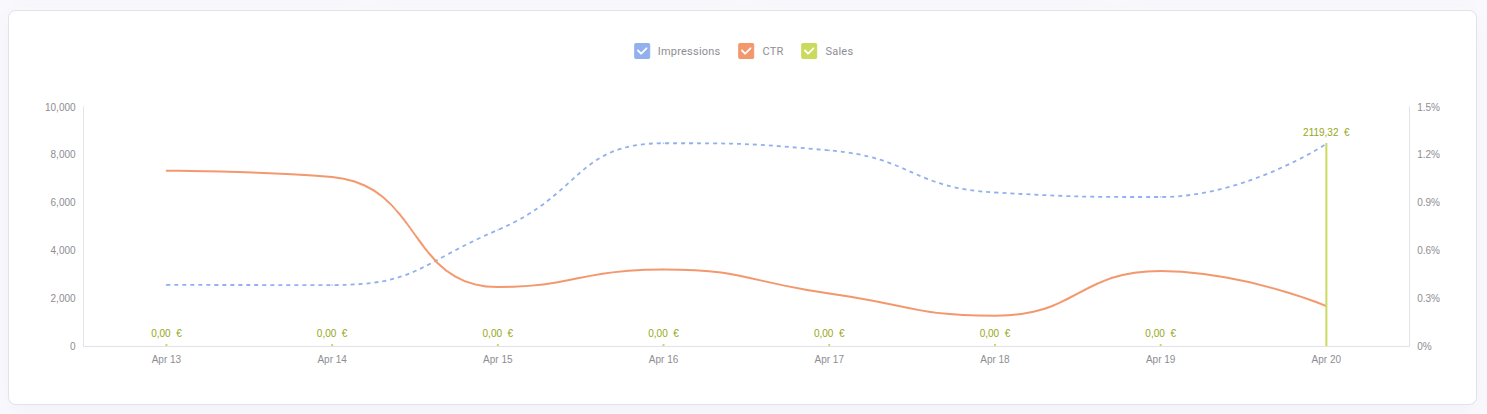
Available metrics on the chart upon selection: impressions (when the carousel loads, then an impression is registered), CTR and Sales.
In this chart you can switch between metrics, compare time periods, etc. This section helps identify seasonality, campaign impact, or performance drops.
Recommendation Carousels Breakdown
At the bottom of the page, a detailed table provides performance data for each Recommendation carousel.
The table columns include:
- Carousel title
- Impressions
- CTR
- CR
This breakdown allow users to:
- Identify top-performing carousels.
- Detect underperforming placements.
- Optimize widget positioning and logic.
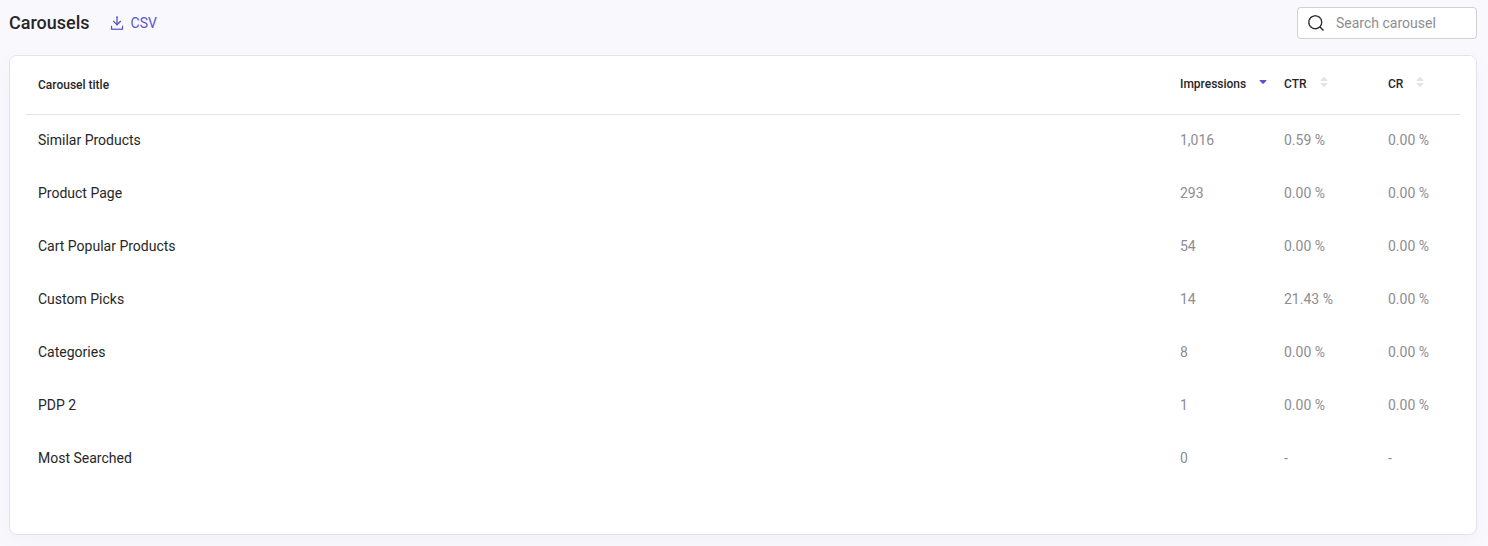
Download Stats Reports
You can download detailed CSV reports for deeper analysis. However, notice that there is a defined limit that permits data to be downloaded for a maximum period of three months.
Click on the "CSV" button, right on top of the Carousel breakdown table. A download link will be sent to your email, which will include the following content:
| Column | Description |
|---|---|
hashid |
Search Engine identifier |
carousel name |
Carousel title |
total_impressions |
Total number of times the carousel has been displayed |
total_clicks |
Total number of clicks made on the carousel |
carousel_CTR |
Overall click-through rate of the carousel (total_clicks / total_impressions) |
carousel_avg_click_position |
Average position of clicks made on the carousel, weighted by number of clicks |
clicked_product_ids |
dfIDs of clicked products (can be separated by ;) |
clicked_product_names |
Names of clicked products, in the same order (can be separated by ;) |
clicked_product_link |
URLs of clicked products, in the same order (can be separated by ;) |
product_clicks |
Number of clicks per product, in the same order (can be separated by ;) |
Missing data in clicked_product_names or clicked_product_link? This usually happens with custom product card templates. Make sure your product cards include the data-title and data-link attributes. Without those, clicks are tracked lacking title or link information.
See how to check your product card template clicking here.